Immigrants from Mexico vs Immigrants from Italy Unemployment Among Women with Children Under 18 years
COMPARE
Immigrants from Mexico
Immigrants from Italy
Unemployment Among Women with Children Under 18 years
Unemployment Among Women with Children Under 18 years Comparison
Immigrants from Mexico
Immigrants from Italy
6.6%
UNEMPLOYMENT AMONG WOMEN WITH CHILDREN UNDER 18 YEARS
0.0/ 100
METRIC RATING
312th/ 347
METRIC RANK
5.3%
UNEMPLOYMENT AMONG WOMEN WITH CHILDREN UNDER 18 YEARS
82.3/ 100
METRIC RATING
129th/ 347
METRIC RANK
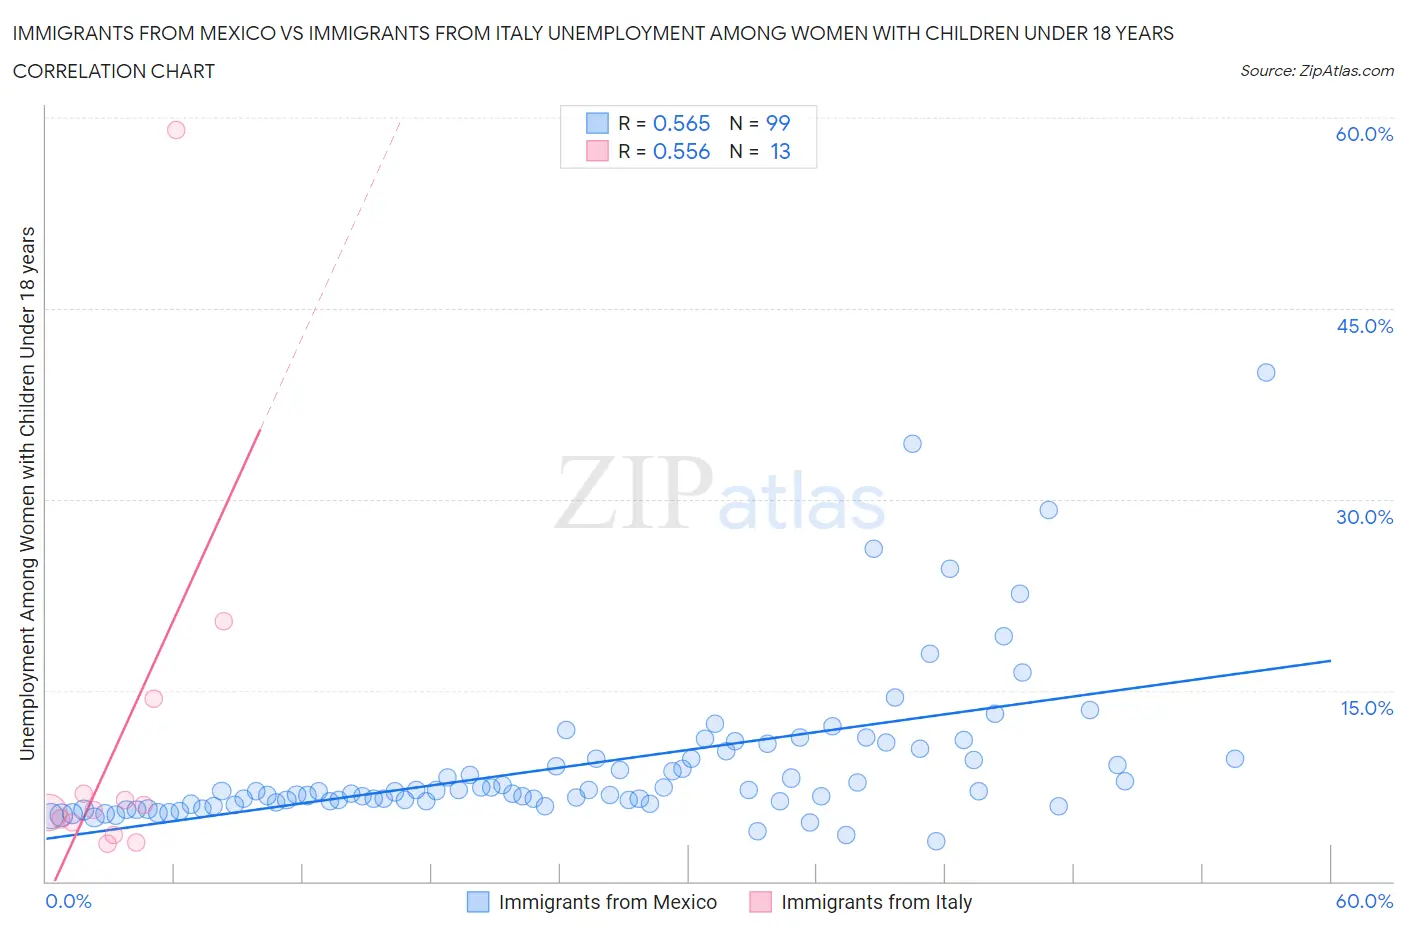
Immigrants from Mexico vs Immigrants from Italy Unemployment Among Women with Children Under 18 years Correlation Chart
The statistical analysis conducted on geographies consisting of 478,971,563 people shows a substantial positive correlation between the proportion of Immigrants from Mexico and unemployment rate among women with children under the age of 18 in the United States with a correlation coefficient (R) of 0.565 and weighted average of 6.6%. Similarly, the statistical analysis conducted on geographies consisting of 312,548,570 people shows a substantial positive correlation between the proportion of Immigrants from Italy and unemployment rate among women with children under the age of 18 in the United States with a correlation coefficient (R) of 0.556 and weighted average of 5.3%, a difference of 24.3%.
Unemployment Among Women with Children Under 18 years Correlation Summary
| Measurement | Immigrants from Mexico | Immigrants from Italy |
| Minimum | 3.1% | 2.9% |
| Maximum | 40.0% | 59.0% |
| Range | 36.9% | 56.1% |
| Mean | 9.2% | 11.0% |
| Median | 7.1% | 5.6% |
| Interquartile 25% (IQ1) | 6.2% | 4.1% |
| Interquartile 75% (IQ3) | 9.6% | 10.6% |
| Interquartile Range (IQR) | 3.4% | 6.5% |
| Standard Deviation (Sample) | 6.1% | 15.2% |
| Standard Deviation (Population) | 6.1% | 14.6% |
Similar Demographics by Unemployment Among Women with Children Under 18 years
Demographics Similar to Immigrants from Mexico by Unemployment Among Women with Children Under 18 years
In terms of unemployment among women with children under 18 years, the demographic groups most similar to Immigrants from Mexico are Yaqui (6.6%, a difference of 0.090%), Hispanic or Latino (6.6%, a difference of 0.29%), Guyanese (6.6%, a difference of 0.39%), British West Indian (6.6%, a difference of 0.43%), and Immigrants from West Indies (6.6%, a difference of 0.43%).
| Demographics | Rating | Rank | Unemployment Among Women with Children Under 18 years |
| Immigrants | Central America | 0.0 /100 | #305 | Tragic 6.5% |
| Immigrants | Guyana | 0.0 /100 | #306 | Tragic 6.5% |
| Belizeans | 0.0 /100 | #307 | Tragic 6.5% |
| Africans | 0.0 /100 | #308 | Tragic 6.5% |
| Ecuadorians | 0.0 /100 | #309 | Tragic 6.5% |
| Guyanese | 0.0 /100 | #310 | Tragic 6.6% |
| Yaqui | 0.0 /100 | #311 | Tragic 6.6% |
| Immigrants | Mexico | 0.0 /100 | #312 | Tragic 6.6% |
| Hispanics or Latinos | 0.0 /100 | #313 | Tragic 6.6% |
| British West Indians | 0.0 /100 | #314 | Tragic 6.6% |
| Immigrants | West Indies | 0.0 /100 | #315 | Tragic 6.6% |
| Immigrants | Ecuador | 0.0 /100 | #316 | Tragic 6.6% |
| Shoshone | 0.0 /100 | #317 | Tragic 6.6% |
| Alaska Natives | 0.0 /100 | #318 | Tragic 6.7% |
| Central American Indians | 0.0 /100 | #319 | Tragic 6.7% |
Demographics Similar to Immigrants from Italy by Unemployment Among Women with Children Under 18 years
In terms of unemployment among women with children under 18 years, the demographic groups most similar to Immigrants from Italy are Immigrants from Austria (5.3%, a difference of 0.030%), Immigrants from South Africa (5.3%, a difference of 0.050%), Immigrants from Israel (5.3%, a difference of 0.050%), White/Caucasian (5.3%, a difference of 0.070%), and Immigrants from Oceania (5.3%, a difference of 0.10%).
| Demographics | Rating | Rank | Unemployment Among Women with Children Under 18 years |
| Scotch-Irish | 85.7 /100 | #122 | Excellent 5.3% |
| Sudanese | 84.3 /100 | #123 | Excellent 5.3% |
| Native Hawaiians | 84.0 /100 | #124 | Excellent 5.3% |
| Immigrants | North Macedonia | 83.2 /100 | #125 | Excellent 5.3% |
| Immigrants | Oceania | 83.1 /100 | #126 | Excellent 5.3% |
| Whites/Caucasians | 82.9 /100 | #127 | Excellent 5.3% |
| Immigrants | South Africa | 82.8 /100 | #128 | Excellent 5.3% |
| Immigrants | Italy | 82.3 /100 | #129 | Excellent 5.3% |
| Immigrants | Austria | 82.1 /100 | #130 | Excellent 5.3% |
| Immigrants | Israel | 81.9 /100 | #131 | Excellent 5.3% |
| Immigrants | Ethiopia | 81.4 /100 | #132 | Excellent 5.3% |
| Ethiopians | 80.7 /100 | #133 | Excellent 5.3% |
| Slovaks | 80.5 /100 | #134 | Excellent 5.3% |
| New Zealanders | 79.9 /100 | #135 | Good 5.3% |
| Immigrants | Jordan | 79.5 /100 | #136 | Good 5.3% |