Immigrants from Latvia vs South African Unemployment Among Seniors over 75 years
COMPARE
Immigrants from Latvia
South African
Unemployment Among Seniors over 75 years
Unemployment Among Seniors over 75 years Comparison
Immigrants from Latvia
South Africans
7.8%
UNEMPLOYMENT AMONG SENIORS OVER 75 YEARS
100.0/ 100
METRIC RATING
50th/ 347
METRIC RANK
7.5%
UNEMPLOYMENT AMONG SENIORS OVER 75 YEARS
100.0/ 100
METRIC RATING
26th/ 347
METRIC RANK
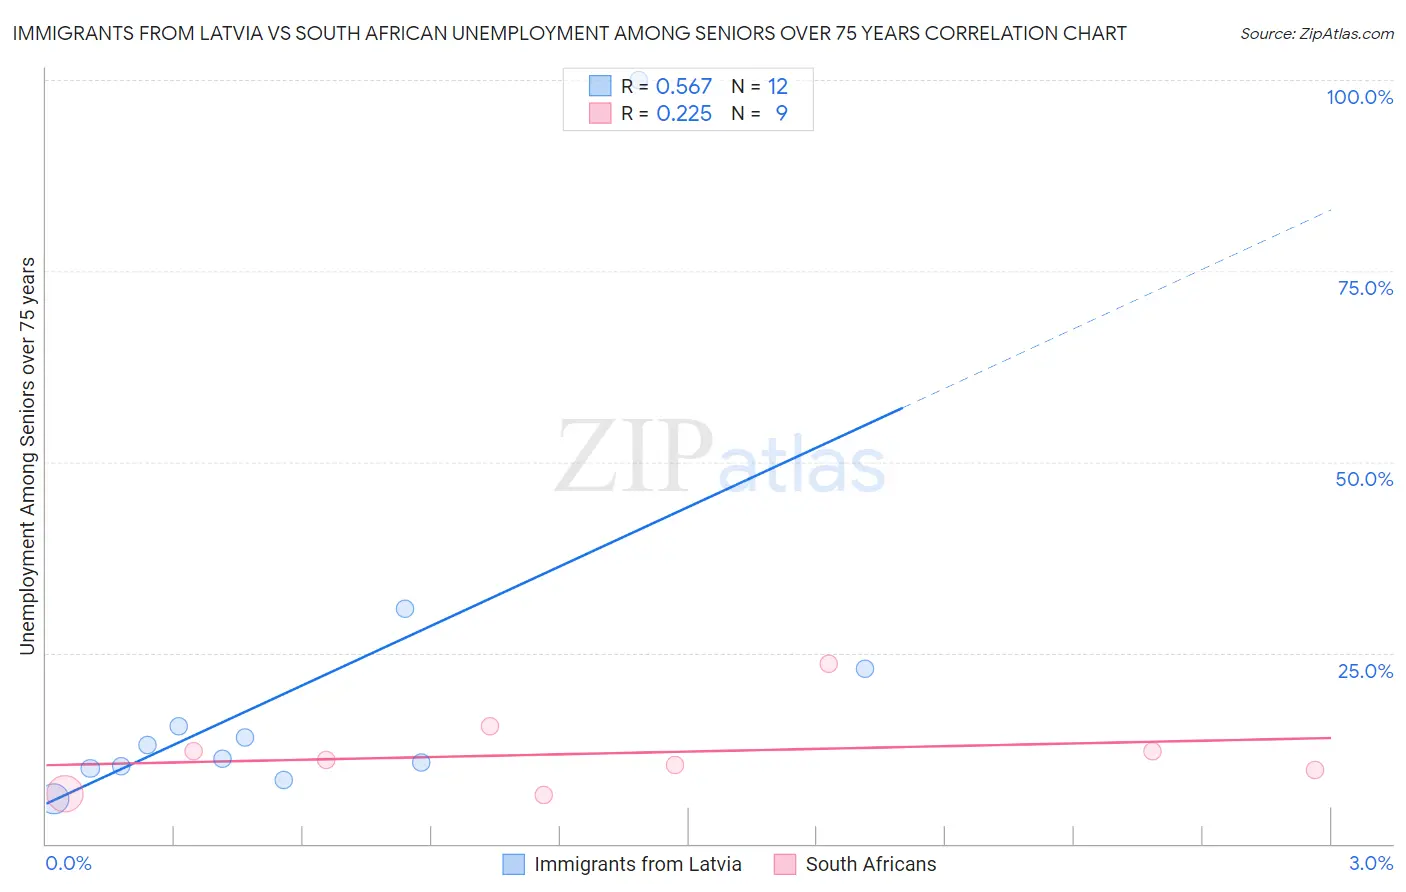
Immigrants from Latvia vs South African Unemployment Among Seniors over 75 years Correlation Chart
The statistical analysis conducted on geographies consisting of 84,059,408 people shows a substantial positive correlation between the proportion of Immigrants from Latvia and unemployment rate among seniors over the age of 75 in the United States with a correlation coefficient (R) of 0.567 and weighted average of 7.8%. Similarly, the statistical analysis conducted on geographies consisting of 121,244,008 people shows a weak positive correlation between the proportion of South Africans and unemployment rate among seniors over the age of 75 in the United States with a correlation coefficient (R) of 0.225 and weighted average of 7.5%, a difference of 3.9%.
Unemployment Among Seniors over 75 years Correlation Summary
| Measurement | Immigrants from Latvia | South African |
| Minimum | 5.8% | 6.4% |
| Maximum | 100.0% | 23.5% |
| Range | 94.2% | 17.1% |
| Mean | 21.0% | 11.9% |
| Median | 12.0% | 11.0% |
| Interquartile 25% (IQ1) | 10.0% | 8.1% |
| Interquartile 75% (IQ3) | 19.1% | 13.7% |
| Interquartile Range (IQR) | 9.1% | 5.7% |
| Standard Deviation (Sample) | 25.8% | 5.2% |
| Standard Deviation (Population) | 24.7% | 4.9% |
Similar Demographics by Unemployment Among Seniors over 75 years
Demographics Similar to Immigrants from Latvia by Unemployment Among Seniors over 75 years
In terms of unemployment among seniors over 75 years, the demographic groups most similar to Immigrants from Latvia are Potawatomi (7.8%, a difference of 0.020%), Immigrants from Chile (7.8%, a difference of 0.050%), Moroccan (7.8%, a difference of 0.050%), Creek (7.8%, a difference of 0.28%), and Bahamian (7.8%, a difference of 0.30%).
| Demographics | Rating | Rank | Unemployment Among Seniors over 75 years |
| Immigrants | Denmark | 100.0 /100 | #43 | Exceptional 7.8% |
| Immigrants | Spain | 100.0 /100 | #44 | Exceptional 7.8% |
| British West Indians | 100.0 /100 | #45 | Exceptional 7.8% |
| Immigrants | China | 100.0 /100 | #46 | Exceptional 7.8% |
| Creek | 100.0 /100 | #47 | Exceptional 7.8% |
| Immigrants | Chile | 100.0 /100 | #48 | Exceptional 7.8% |
| Potawatomi | 100.0 /100 | #49 | Exceptional 7.8% |
| Immigrants | Latvia | 100.0 /100 | #50 | Exceptional 7.8% |
| Moroccans | 100.0 /100 | #51 | Exceptional 7.8% |
| Bahamians | 100.0 /100 | #52 | Exceptional 7.8% |
| Immigrants | Egypt | 100.0 /100 | #53 | Exceptional 7.9% |
| Immigrants | Malaysia | 99.9 /100 | #54 | Exceptional 7.9% |
| Filipinos | 99.9 /100 | #55 | Exceptional 7.9% |
| Immigrants | Eastern Asia | 99.9 /100 | #56 | Exceptional 7.9% |
| Ottawa | 99.9 /100 | #57 | Exceptional 7.9% |
Demographics Similar to South Africans by Unemployment Among Seniors over 75 years
In terms of unemployment among seniors over 75 years, the demographic groups most similar to South Africans are Immigrants from Uruguay (7.5%, a difference of 0.18%), Immigrants from Barbados (7.6%, a difference of 0.44%), Immigrants from Israel (7.6%, a difference of 0.55%), Immigrants from Iran (7.6%, a difference of 0.59%), and Immigrants from Sweden (7.6%, a difference of 0.70%).
| Demographics | Rating | Rank | Unemployment Among Seniors over 75 years |
| Immigrants | Zaire | 100.0 /100 | #19 | Exceptional 7.2% |
| Armenians | 100.0 /100 | #20 | Exceptional 7.2% |
| Chickasaw | 100.0 /100 | #21 | Exceptional 7.3% |
| Cypriots | 100.0 /100 | #22 | Exceptional 7.4% |
| Israelis | 100.0 /100 | #23 | Exceptional 7.4% |
| Immigrants | Cuba | 100.0 /100 | #24 | Exceptional 7.4% |
| Immigrants | Uruguay | 100.0 /100 | #25 | Exceptional 7.5% |
| South Africans | 100.0 /100 | #26 | Exceptional 7.5% |
| Immigrants | Barbados | 100.0 /100 | #27 | Exceptional 7.6% |
| Immigrants | Israel | 100.0 /100 | #28 | Exceptional 7.6% |
| Immigrants | Iran | 100.0 /100 | #29 | Exceptional 7.6% |
| Immigrants | Sweden | 100.0 /100 | #30 | Exceptional 7.6% |
| Guyanese | 100.0 /100 | #31 | Exceptional 7.6% |
| Immigrants | Hong Kong | 100.0 /100 | #32 | Exceptional 7.6% |
| Cambodians | 100.0 /100 | #33 | Exceptional 7.6% |