Immigrants from Latin America vs Welsh Male Unemployment
COMPARE
Immigrants from Latin America
Welsh
Male Unemployment
Male Unemployment Comparison
Immigrants from Latin America
Welsh
5.9%
MALE UNEMPLOYMENT
0.1/ 100
METRIC RATING
263rd/ 347
METRIC RANK
4.8%
MALE UNEMPLOYMENT
99.7/ 100
METRIC RATING
34th/ 347
METRIC RANK
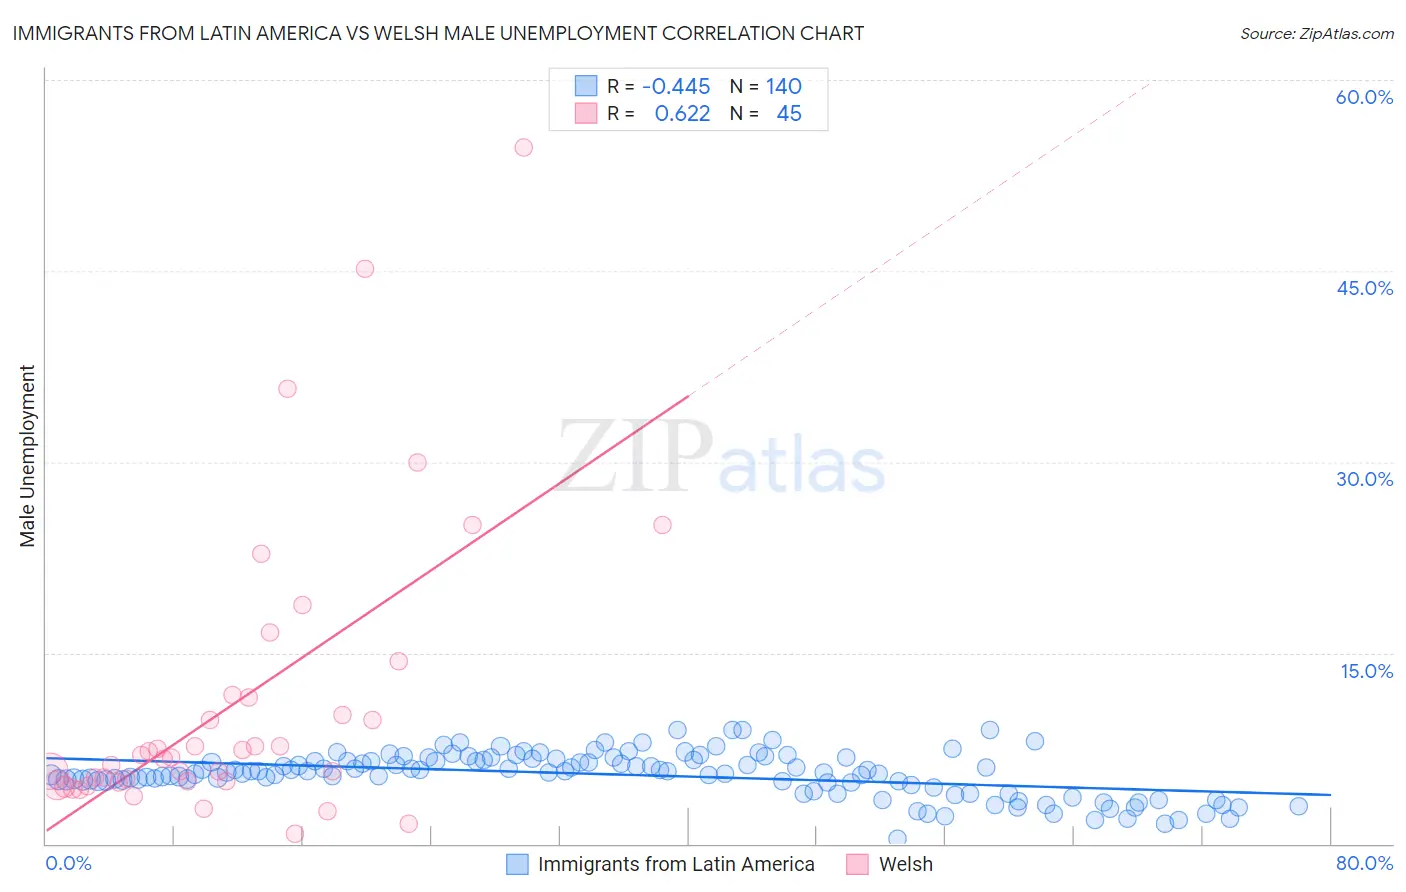
Immigrants from Latin America vs Welsh Male Unemployment Correlation Chart
The statistical analysis conducted on geographies consisting of 550,432,007 people shows a moderate negative correlation between the proportion of Immigrants from Latin America and unemployment rate among males in the United States with a correlation coefficient (R) of -0.445 and weighted average of 5.9%. Similarly, the statistical analysis conducted on geographies consisting of 521,279,877 people shows a significant positive correlation between the proportion of Welsh and unemployment rate among males in the United States with a correlation coefficient (R) of 0.622 and weighted average of 4.8%, a difference of 21.1%.
Male Unemployment Correlation Summary
| Measurement | Immigrants from Latin America | Welsh |
| Minimum | 0.40% | 0.80% |
| Maximum | 9.0% | 54.7% |
| Range | 8.6% | 53.9% |
| Mean | 5.4% | 11.1% |
| Median | 5.6% | 6.8% |
| Interquartile 25% (IQ1) | 4.8% | 4.9% |
| Interquartile 75% (IQ3) | 6.6% | 11.6% |
| Interquartile Range (IQR) | 1.8% | 6.7% |
| Standard Deviation (Sample) | 1.7% | 11.5% |
| Standard Deviation (Population) | 1.7% | 11.3% |
Similar Demographics by Male Unemployment
Demographics Similar to Immigrants from Latin America by Male Unemployment
In terms of male unemployment, the demographic groups most similar to Immigrants from Latin America are Immigrants from Mexico (5.9%, a difference of 0.22%), Immigrants from Portugal (5.9%, a difference of 0.24%), French American Indian (5.9%, a difference of 0.61%), Liberian (5.8%, a difference of 0.69%), and Bahamian (5.9%, a difference of 0.75%).
| Demographics | Rating | Rank | Male Unemployment |
| Comanche | 0.2 /100 | #256 | Tragic 5.8% |
| Hispanics or Latinos | 0.1 /100 | #257 | Tragic 5.8% |
| Dutch West Indians | 0.1 /100 | #258 | Tragic 5.8% |
| Cajuns | 0.1 /100 | #259 | Tragic 5.8% |
| Immigrants | Central America | 0.1 /100 | #260 | Tragic 5.8% |
| Liberians | 0.1 /100 | #261 | Tragic 5.8% |
| Immigrants | Portugal | 0.1 /100 | #262 | Tragic 5.9% |
| Immigrants | Latin America | 0.1 /100 | #263 | Tragic 5.9% |
| Immigrants | Mexico | 0.0 /100 | #264 | Tragic 5.9% |
| French American Indians | 0.0 /100 | #265 | Tragic 5.9% |
| Bahamians | 0.0 /100 | #266 | Tragic 5.9% |
| Nigerians | 0.0 /100 | #267 | Tragic 5.9% |
| Bermudans | 0.0 /100 | #268 | Tragic 5.9% |
| Immigrants | Nigeria | 0.0 /100 | #269 | Tragic 6.0% |
| Sub-Saharan Africans | 0.0 /100 | #270 | Tragic 6.0% |
Demographics Similar to Welsh by Male Unemployment
In terms of male unemployment, the demographic groups most similar to Welsh are Latvian (4.8%, a difference of 0.080%), Immigrants from Nepal (4.8%, a difference of 0.38%), Sudanese (4.8%, a difference of 0.40%), British (4.8%, a difference of 0.65%), and Paraguayan (4.9%, a difference of 0.85%).
| Demographics | Rating | Rank | Male Unemployment |
| Belgians | 99.9 /100 | #27 | Exceptional 4.8% |
| Bulgarians | 99.8 /100 | #28 | Exceptional 4.8% |
| Scottish | 99.8 /100 | #29 | Exceptional 4.8% |
| British | 99.8 /100 | #30 | Exceptional 4.8% |
| Sudanese | 99.8 /100 | #31 | Exceptional 4.8% |
| Immigrants | Nepal | 99.8 /100 | #32 | Exceptional 4.8% |
| Latvians | 99.7 /100 | #33 | Exceptional 4.8% |
| Welsh | 99.7 /100 | #34 | Exceptional 4.8% |
| Paraguayans | 99.5 /100 | #35 | Exceptional 4.9% |
| Immigrants | Singapore | 99.4 /100 | #36 | Exceptional 4.9% |
| Scotch-Irish | 99.4 /100 | #37 | Exceptional 4.9% |
| Immigrants | Bosnia and Herzegovina | 99.4 /100 | #38 | Exceptional 4.9% |
| Burmese | 99.3 /100 | #39 | Exceptional 4.9% |
| Northern Europeans | 99.3 /100 | #40 | Exceptional 4.9% |
| Chinese | 99.3 /100 | #41 | Exceptional 4.9% |