Immigrants from Latin America vs Immigrants from Taiwan Male Unemployment
COMPARE
Immigrants from Latin America
Immigrants from Taiwan
Male Unemployment
Male Unemployment Comparison
Immigrants from Latin America
Immigrants from Taiwan
5.9%
MALE UNEMPLOYMENT
0.1/ 100
METRIC RATING
263rd/ 347
METRIC RANK
4.8%
MALE UNEMPLOYMENT
99.9/ 100
METRIC RATING
21st/ 347
METRIC RANK
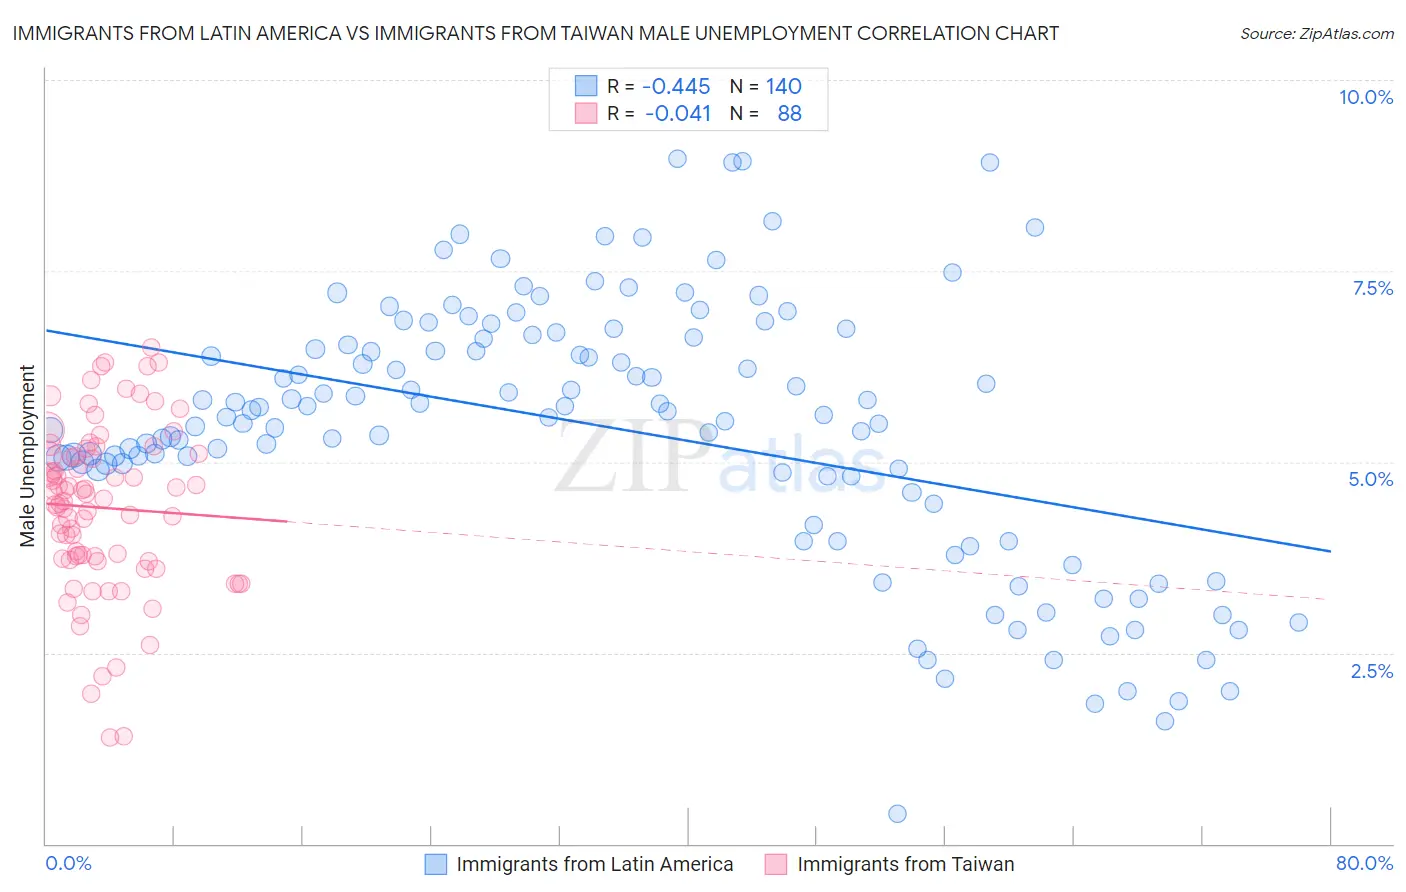
Immigrants from Latin America vs Immigrants from Taiwan Male Unemployment Correlation Chart
The statistical analysis conducted on geographies consisting of 550,432,007 people shows a moderate negative correlation between the proportion of Immigrants from Latin America and unemployment rate among males in the United States with a correlation coefficient (R) of -0.445 and weighted average of 5.9%. Similarly, the statistical analysis conducted on geographies consisting of 297,680,447 people shows no correlation between the proportion of Immigrants from Taiwan and unemployment rate among males in the United States with a correlation coefficient (R) of -0.041 and weighted average of 4.8%, a difference of 23.2%.
Male Unemployment Correlation Summary
| Measurement | Immigrants from Latin America | Immigrants from Taiwan |
| Minimum | 0.40% | 1.4% |
| Maximum | 9.0% | 6.5% |
| Range | 8.6% | 5.1% |
| Mean | 5.4% | 4.4% |
| Median | 5.6% | 4.5% |
| Interquartile 25% (IQ1) | 4.8% | 3.7% |
| Interquartile 75% (IQ3) | 6.6% | 5.1% |
| Interquartile Range (IQR) | 1.8% | 1.4% |
| Standard Deviation (Sample) | 1.7% | 1.1% |
| Standard Deviation (Population) | 1.7% | 1.1% |
Similar Demographics by Male Unemployment
Demographics Similar to Immigrants from Latin America by Male Unemployment
In terms of male unemployment, the demographic groups most similar to Immigrants from Latin America are Immigrants from Mexico (5.9%, a difference of 0.22%), Immigrants from Portugal (5.9%, a difference of 0.24%), French American Indian (5.9%, a difference of 0.61%), Liberian (5.8%, a difference of 0.69%), and Bahamian (5.9%, a difference of 0.75%).
| Demographics | Rating | Rank | Male Unemployment |
| Comanche | 0.2 /100 | #256 | Tragic 5.8% |
| Hispanics or Latinos | 0.1 /100 | #257 | Tragic 5.8% |
| Dutch West Indians | 0.1 /100 | #258 | Tragic 5.8% |
| Cajuns | 0.1 /100 | #259 | Tragic 5.8% |
| Immigrants | Central America | 0.1 /100 | #260 | Tragic 5.8% |
| Liberians | 0.1 /100 | #261 | Tragic 5.8% |
| Immigrants | Portugal | 0.1 /100 | #262 | Tragic 5.9% |
| Immigrants | Latin America | 0.1 /100 | #263 | Tragic 5.9% |
| Immigrants | Mexico | 0.0 /100 | #264 | Tragic 5.9% |
| French American Indians | 0.0 /100 | #265 | Tragic 5.9% |
| Bahamians | 0.0 /100 | #266 | Tragic 5.9% |
| Nigerians | 0.0 /100 | #267 | Tragic 5.9% |
| Bermudans | 0.0 /100 | #268 | Tragic 5.9% |
| Immigrants | Nigeria | 0.0 /100 | #269 | Tragic 6.0% |
| Sub-Saharan Africans | 0.0 /100 | #270 | Tragic 6.0% |
Demographics Similar to Immigrants from Taiwan by Male Unemployment
In terms of male unemployment, the demographic groups most similar to Immigrants from Taiwan are Carpatho Rusyn (4.8%, a difference of 0.010%), Tongan (4.8%, a difference of 0.060%), Immigrants from South Central Asia (4.8%, a difference of 0.090%), Pennsylvania German (4.8%, a difference of 0.16%), and Zimbabwean (4.8%, a difference of 0.19%).
| Demographics | Rating | Rank | Male Unemployment |
| Germans | 100.0 /100 | #14 | Exceptional 4.7% |
| Scandinavians | 100.0 /100 | #15 | Exceptional 4.7% |
| Swiss | 99.9 /100 | #16 | Exceptional 4.7% |
| Filipinos | 99.9 /100 | #17 | Exceptional 4.7% |
| English | 99.9 /100 | #18 | Exceptional 4.8% |
| Europeans | 99.9 /100 | #19 | Exceptional 4.8% |
| Pennsylvania Germans | 99.9 /100 | #20 | Exceptional 4.8% |
| Immigrants | Taiwan | 99.9 /100 | #21 | Exceptional 4.8% |
| Carpatho Rusyns | 99.9 /100 | #22 | Exceptional 4.8% |
| Tongans | 99.9 /100 | #23 | Exceptional 4.8% |
| Immigrants | South Central Asia | 99.9 /100 | #24 | Exceptional 4.8% |
| Zimbabweans | 99.9 /100 | #25 | Exceptional 4.8% |
| Dutch | 99.9 /100 | #26 | Exceptional 4.8% |
| Belgians | 99.9 /100 | #27 | Exceptional 4.8% |
| Bulgarians | 99.8 /100 | #28 | Exceptional 4.8% |