Immigrants from Laos vs Spaniard Male Unemployment
COMPARE
Immigrants from Laos
Spaniard
Male Unemployment
Male Unemployment Comparison
Immigrants from Laos
Spaniards
5.4%
MALE UNEMPLOYMENT
13.0/ 100
METRIC RATING
203rd/ 347
METRIC RANK
5.3%
MALE UNEMPLOYMENT
35.1/ 100
METRIC RATING
184th/ 347
METRIC RANK
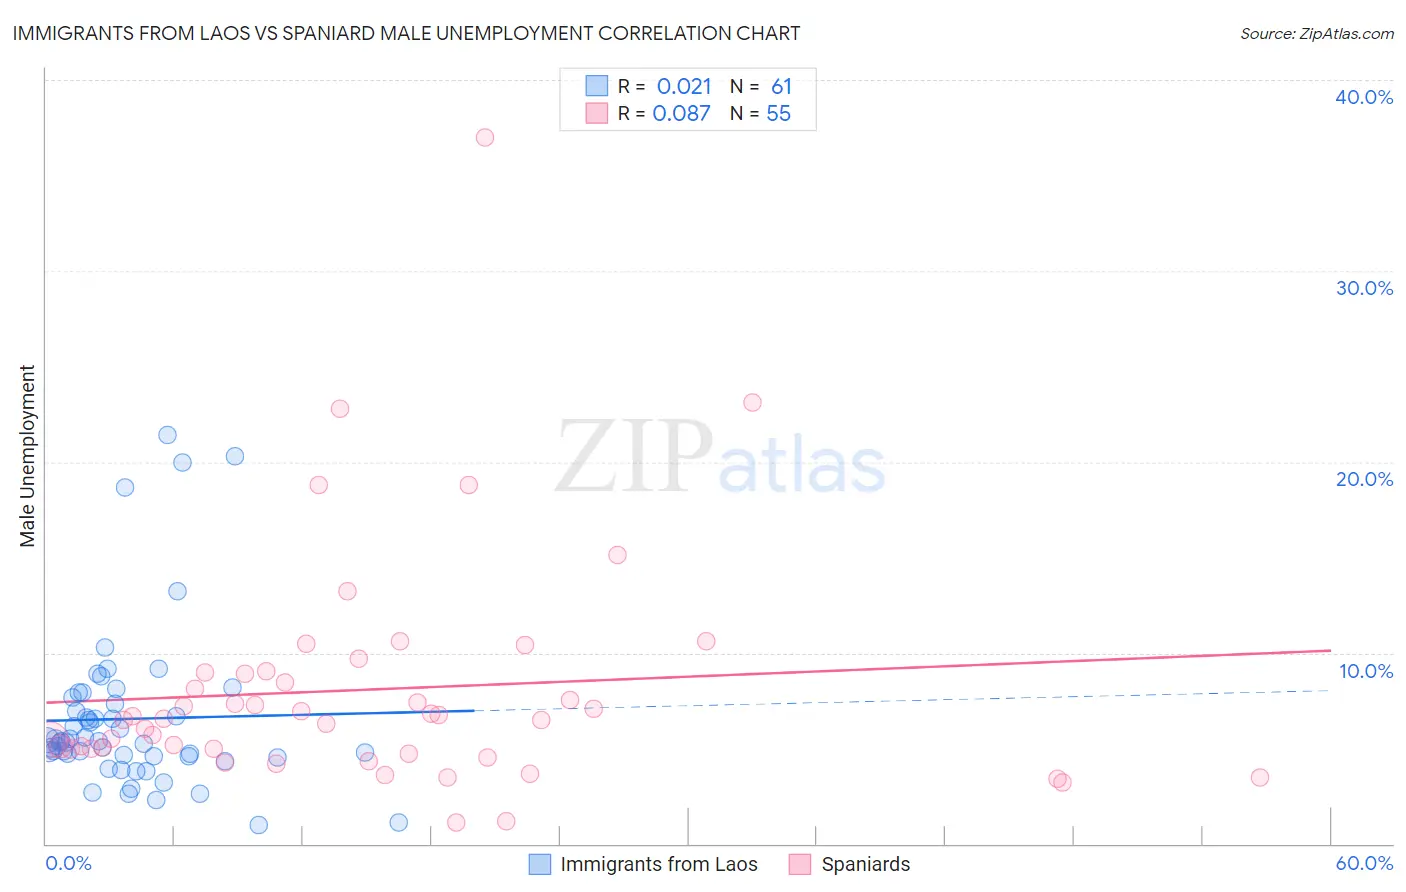
Immigrants from Laos vs Spaniard Male Unemployment Correlation Chart
The statistical analysis conducted on geographies consisting of 201,122,533 people shows no correlation between the proportion of Immigrants from Laos and unemployment rate among males in the United States with a correlation coefficient (R) of 0.021 and weighted average of 5.4%. Similarly, the statistical analysis conducted on geographies consisting of 441,055,878 people shows a slight positive correlation between the proportion of Spaniards and unemployment rate among males in the United States with a correlation coefficient (R) of 0.087 and weighted average of 5.3%, a difference of 1.8%.
Male Unemployment Correlation Summary
| Measurement | Immigrants from Laos | Spaniard |
| Minimum | 1.0% | 1.1% |
| Maximum | 21.4% | 37.0% |
| Range | 20.4% | 35.9% |
| Mean | 6.5% | 8.1% |
| Median | 5.4% | 6.6% |
| Interquartile 25% (IQ1) | 4.6% | 5.0% |
| Interquartile 75% (IQ3) | 7.5% | 8.9% |
| Interquartile Range (IQR) | 2.9% | 4.0% |
| Standard Deviation (Sample) | 4.2% | 6.1% |
| Standard Deviation (Population) | 4.2% | 6.0% |
Demographics Similar to Immigrants from Laos and Spaniards by Male Unemployment
In terms of male unemployment, the demographic groups most similar to Immigrants from Laos are Nonimmigrants (5.4%, a difference of 0.010%), Immigrants from Philippines (5.4%, a difference of 0.050%), Immigrants from Zaire (5.4%, a difference of 0.080%), Immigrants from Greece (5.4%, a difference of 0.18%), and Immigrants from Thailand (5.4%, a difference of 0.20%). Similarly, the demographic groups most similar to Spaniards are Korean (5.3%, a difference of 0.010%), Taiwanese (5.3%, a difference of 0.16%), Iraqi (5.4%, a difference of 0.23%), Costa Rican (5.4%, a difference of 0.24%), and Arab (5.4%, a difference of 0.32%).
| Demographics | Rating | Rank | Male Unemployment |
| Taiwanese | 37.6 /100 | #183 | Fair 5.3% |
| Spaniards | 35.1 /100 | #184 | Fair 5.3% |
| Koreans | 34.9 /100 | #185 | Fair 5.3% |
| Iraqis | 31.6 /100 | #186 | Fair 5.4% |
| Costa Ricans | 31.3 /100 | #187 | Fair 5.4% |
| Arabs | 30.2 /100 | #188 | Fair 5.4% |
| Immigrants | South America | 29.4 /100 | #189 | Fair 5.4% |
| Immigrants | Uganda | 28.8 /100 | #190 | Fair 5.4% |
| Immigrants | South Eastern Asia | 28.2 /100 | #191 | Fair 5.4% |
| Immigrants | Belarus | 26.0 /100 | #192 | Fair 5.4% |
| Immigrants | Israel | 25.2 /100 | #193 | Fair 5.4% |
| Spanish | 19.7 /100 | #194 | Poor 5.4% |
| Immigrants | Southern Europe | 17.7 /100 | #195 | Poor 5.4% |
| Albanians | 17.3 /100 | #196 | Poor 5.4% |
| Alsatians | 16.7 /100 | #197 | Poor 5.4% |
| Immigrants | Thailand | 14.7 /100 | #198 | Poor 5.4% |
| Immigrants | Greece | 14.5 /100 | #199 | Poor 5.4% |
| Immigrants | Zaire | 13.7 /100 | #200 | Poor 5.4% |
| Immigrants | Philippines | 13.5 /100 | #201 | Poor 5.4% |
| Immigrants | Nonimmigrants | 13.1 /100 | #202 | Poor 5.4% |
| Immigrants | Laos | 13.0 /100 | #203 | Poor 5.4% |