Immigrants from Belarus vs Lumbee Male Unemployment
COMPARE
Immigrants from Belarus
Lumbee
Male Unemployment
Male Unemployment Comparison
Immigrants from Belarus
Lumbee
5.4%
MALE UNEMPLOYMENT
26.0/ 100
METRIC RATING
192nd/ 347
METRIC RANK
6.9%
MALE UNEMPLOYMENT
0.0/ 100
METRIC RATING
312th/ 347
METRIC RANK
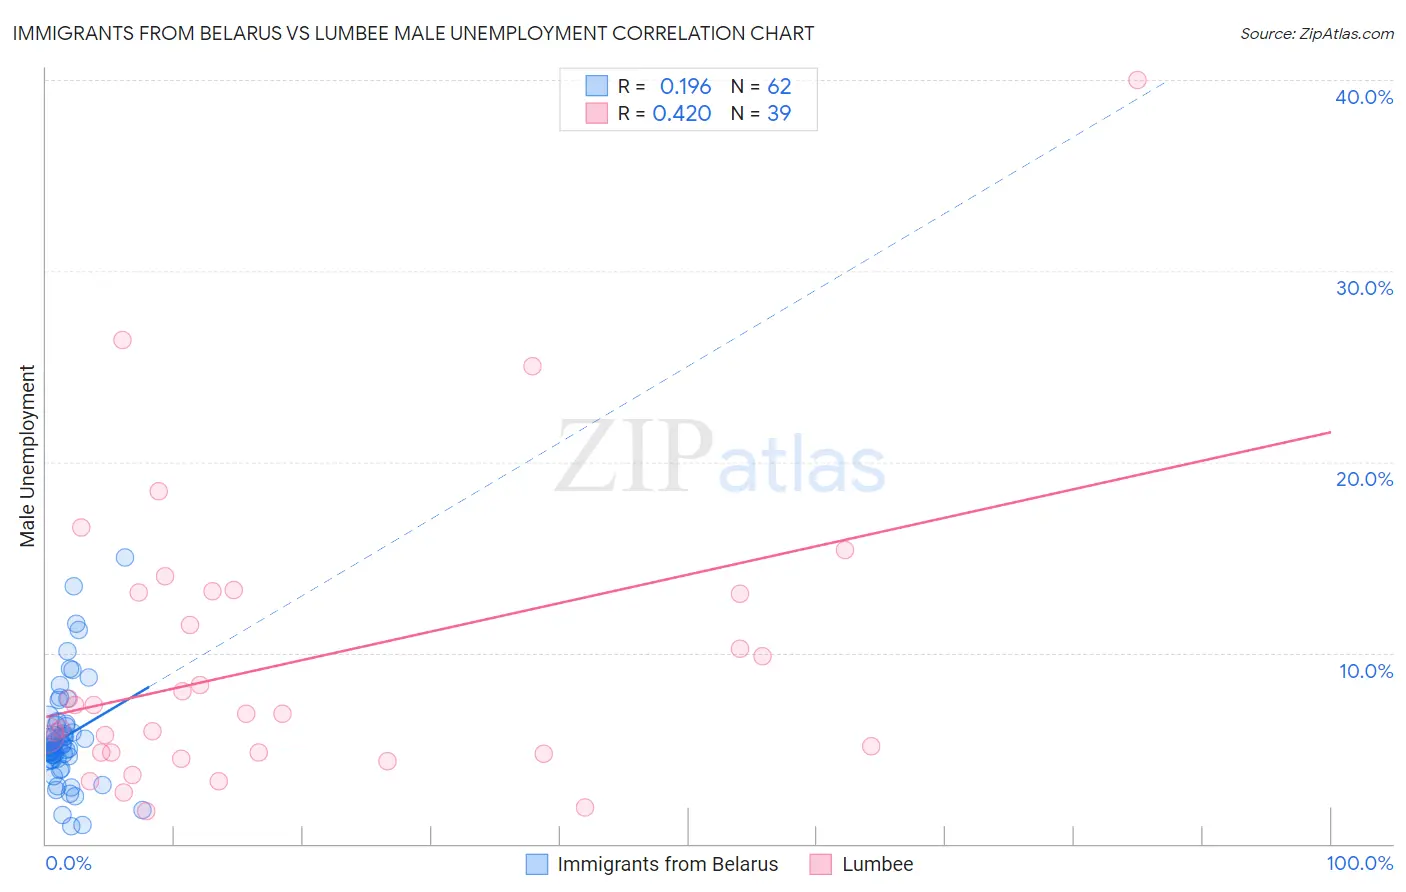
Immigrants from Belarus vs Lumbee Male Unemployment Correlation Chart
The statistical analysis conducted on geographies consisting of 150,060,028 people shows a poor positive correlation between the proportion of Immigrants from Belarus and unemployment rate among males in the United States with a correlation coefficient (R) of 0.196 and weighted average of 5.4%. Similarly, the statistical analysis conducted on geographies consisting of 92,069,666 people shows a moderate positive correlation between the proportion of Lumbee and unemployment rate among males in the United States with a correlation coefficient (R) of 0.420 and weighted average of 6.9%, a difference of 29.0%.
Male Unemployment Correlation Summary
| Measurement | Immigrants from Belarus | Lumbee |
| Minimum | 0.90% | 1.7% |
| Maximum | 15.0% | 40.0% |
| Range | 14.1% | 38.3% |
| Mean | 5.6% | 9.5% |
| Median | 5.1% | 6.8% |
| Interquartile 25% (IQ1) | 4.4% | 4.8% |
| Interquartile 75% (IQ3) | 6.2% | 13.1% |
| Interquartile Range (IQR) | 1.8% | 8.4% |
| Standard Deviation (Sample) | 2.7% | 7.7% |
| Standard Deviation (Population) | 2.7% | 7.6% |
Similar Demographics by Male Unemployment
Demographics Similar to Immigrants from Belarus by Male Unemployment
In terms of male unemployment, the demographic groups most similar to Immigrants from Belarus are Immigrants from Israel (5.4%, a difference of 0.060%), Immigrants from South Eastern Asia (5.4%, a difference of 0.16%), Immigrants from Uganda (5.4%, a difference of 0.20%), Immigrants from South America (5.4%, a difference of 0.24%), and Arab (5.4%, a difference of 0.30%).
| Demographics | Rating | Rank | Male Unemployment |
| Koreans | 34.9 /100 | #185 | Fair 5.3% |
| Iraqis | 31.6 /100 | #186 | Fair 5.4% |
| Costa Ricans | 31.3 /100 | #187 | Fair 5.4% |
| Arabs | 30.2 /100 | #188 | Fair 5.4% |
| Immigrants | South America | 29.4 /100 | #189 | Fair 5.4% |
| Immigrants | Uganda | 28.8 /100 | #190 | Fair 5.4% |
| Immigrants | South Eastern Asia | 28.2 /100 | #191 | Fair 5.4% |
| Immigrants | Belarus | 26.0 /100 | #192 | Fair 5.4% |
| Immigrants | Israel | 25.2 /100 | #193 | Fair 5.4% |
| Spanish | 19.7 /100 | #194 | Poor 5.4% |
| Immigrants | Southern Europe | 17.7 /100 | #195 | Poor 5.4% |
| Albanians | 17.3 /100 | #196 | Poor 5.4% |
| Alsatians | 16.7 /100 | #197 | Poor 5.4% |
| Immigrants | Thailand | 14.7 /100 | #198 | Poor 5.4% |
| Immigrants | Greece | 14.5 /100 | #199 | Poor 5.4% |
Demographics Similar to Lumbee by Male Unemployment
In terms of male unemployment, the demographic groups most similar to Lumbee are Immigrants from Armenia (6.9%, a difference of 0.20%), Black/African American (6.9%, a difference of 0.52%), Immigrants from Dominica (7.0%, a difference of 1.0%), Barbadian (6.9%, a difference of 1.2%), and Aleut (6.8%, a difference of 1.6%).
| Demographics | Rating | Rank | Male Unemployment |
| Trinidadians and Tobagonians | 0.0 /100 | #305 | Tragic 6.7% |
| Immigrants | Trinidad and Tobago | 0.0 /100 | #306 | Tragic 6.7% |
| Immigrants | Jamaica | 0.0 /100 | #307 | Tragic 6.7% |
| Aleuts | 0.0 /100 | #308 | Tragic 6.8% |
| Barbadians | 0.0 /100 | #309 | Tragic 6.9% |
| Blacks/African Americans | 0.0 /100 | #310 | Tragic 6.9% |
| Immigrants | Armenia | 0.0 /100 | #311 | Tragic 6.9% |
| Lumbee | 0.0 /100 | #312 | Tragic 6.9% |
| Immigrants | Dominica | 0.0 /100 | #313 | Tragic 7.0% |
| Immigrants | Barbados | 0.0 /100 | #314 | Tragic 7.1% |
| Houma | 0.0 /100 | #315 | Tragic 7.1% |
| Immigrants | Guyana | 0.0 /100 | #316 | Tragic 7.1% |
| Guyanese | 0.0 /100 | #317 | Tragic 7.1% |
| Cape Verdeans | 0.0 /100 | #318 | Tragic 7.1% |
| British West Indians | 0.0 /100 | #319 | Tragic 7.3% |