Immigrants from Yemen vs Latvian Unemployment Among Women with Children Ages 6 to 17 years
COMPARE
Immigrants from Yemen
Latvian
Unemployment Among Women with Children Ages 6 to 17 years
Unemployment Among Women with Children Ages 6 to 17 years Comparison
Immigrants from Yemen
Latvians
12.7%
UNEMPLOYMENT AMONG WOMEN WITH CHILDREN AGES 6 TO 17 YEARS
0.0/ 100
METRIC RATING
337th/ 347
METRIC RANK
8.6%
UNEMPLOYMENT AMONG WOMEN WITH CHILDREN AGES 6 TO 17 YEARS
97.4/ 100
METRIC RATING
110th/ 347
METRIC RANK
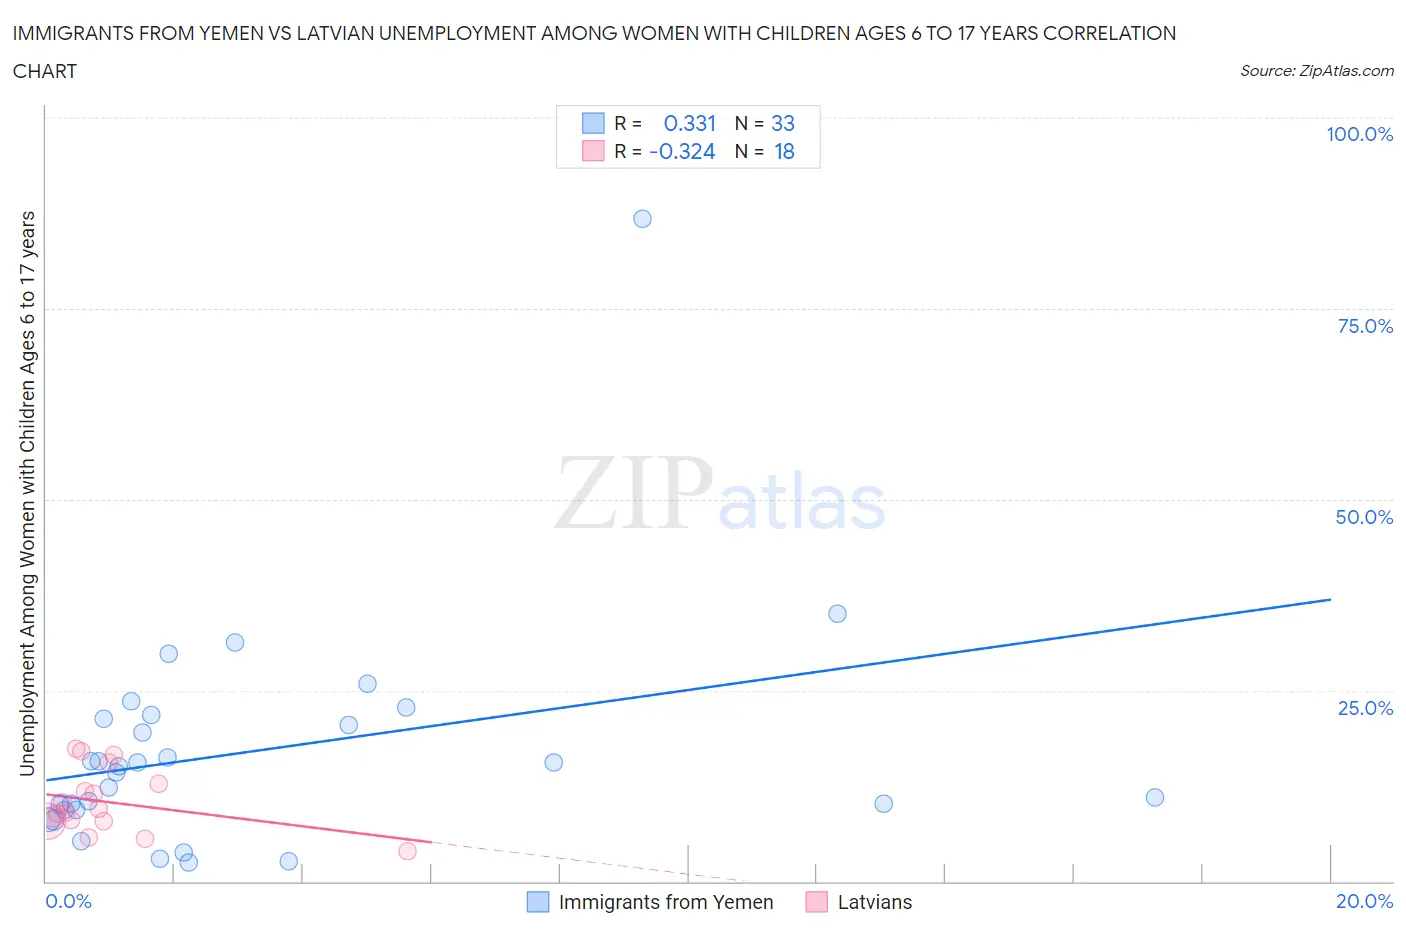
Immigrants from Yemen vs Latvian Unemployment Among Women with Children Ages 6 to 17 years Correlation Chart
The statistical analysis conducted on geographies consisting of 75,031,826 people shows a mild positive correlation between the proportion of Immigrants from Yemen and unemployment rate among women with children between the ages 6 and 17 in the United States with a correlation coefficient (R) of 0.331 and weighted average of 12.7%. Similarly, the statistical analysis conducted on geographies consisting of 167,334,916 people shows a mild negative correlation between the proportion of Latvians and unemployment rate among women with children between the ages 6 and 17 in the United States with a correlation coefficient (R) of -0.324 and weighted average of 8.6%, a difference of 47.7%.
Unemployment Among Women with Children Ages 6 to 17 years Correlation Summary
| Measurement | Immigrants from Yemen | Latvian |
| Minimum | 2.4% | 3.9% |
| Maximum | 86.7% | 17.3% |
| Range | 84.3% | 13.4% |
| Mean | 17.0% | 10.4% |
| Median | 15.1% | 9.2% |
| Interquartile 25% (IQ1) | 9.3% | 7.8% |
| Interquartile 75% (IQ3) | 21.5% | 12.7% |
| Interquartile Range (IQR) | 12.2% | 4.9% |
| Standard Deviation (Sample) | 15.0% | 4.1% |
| Standard Deviation (Population) | 14.8% | 3.9% |
Similar Demographics by Unemployment Among Women with Children Ages 6 to 17 years
Demographics Similar to Immigrants from Yemen by Unemployment Among Women with Children Ages 6 to 17 years
In terms of unemployment among women with children ages 6 to 17 years, the demographic groups most similar to Immigrants from Yemen are Hopi (12.9%, a difference of 1.5%), Houma (12.5%, a difference of 1.9%), Colville (12.3%, a difference of 2.9%), Sioux (13.2%, a difference of 4.2%), and Ugandan (12.0%, a difference of 5.7%).
| Demographics | Rating | Rank | Unemployment Among Women with Children Ages 6 to 17 years |
| Chippewa | 0.0 /100 | #330 | Tragic 11.1% |
| Blacks/African Americans | 0.0 /100 | #331 | Tragic 11.4% |
| Tsimshian | 0.0 /100 | #332 | Tragic 11.4% |
| Natives/Alaskans | 0.0 /100 | #333 | Tragic 11.5% |
| Ugandans | 0.0 /100 | #334 | Tragic 12.0% |
| Colville | 0.0 /100 | #335 | Tragic 12.3% |
| Houma | 0.0 /100 | #336 | Tragic 12.5% |
| Immigrants | Yemen | 0.0 /100 | #337 | Tragic 12.7% |
| Hopi | 0.0 /100 | #338 | Tragic 12.9% |
| Sioux | 0.0 /100 | #339 | Tragic 13.2% |
| Puerto Ricans | 0.0 /100 | #340 | Tragic 13.9% |
| Navajo | 0.0 /100 | #341 | Tragic 14.2% |
| Yuman | 0.0 /100 | #342 | Tragic 14.8% |
| Inupiat | 0.0 /100 | #343 | Tragic 14.9% |
| Cheyenne | 0.0 /100 | #344 | Tragic 16.4% |
Demographics Similar to Latvians by Unemployment Among Women with Children Ages 6 to 17 years
In terms of unemployment among women with children ages 6 to 17 years, the demographic groups most similar to Latvians are Immigrants from Romania (8.6%, a difference of 0.010%), Immigrants from Ukraine (8.6%, a difference of 0.010%), Swedish (8.6%, a difference of 0.080%), Chickasaw (8.6%, a difference of 0.090%), and Immigrants from Serbia (8.6%, a difference of 0.12%).
| Demographics | Rating | Rank | Unemployment Among Women with Children Ages 6 to 17 years |
| Scandinavians | 98.3 /100 | #103 | Exceptional 8.6% |
| Immigrants | France | 98.0 /100 | #104 | Exceptional 8.6% |
| Immigrants | Norway | 97.8 /100 | #105 | Exceptional 8.6% |
| Immigrants | Serbia | 97.7 /100 | #106 | Exceptional 8.6% |
| Chickasaw | 97.6 /100 | #107 | Exceptional 8.6% |
| Swedes | 97.6 /100 | #108 | Exceptional 8.6% |
| Immigrants | Romania | 97.5 /100 | #109 | Exceptional 8.6% |
| Latvians | 97.4 /100 | #110 | Exceptional 8.6% |
| Immigrants | Ukraine | 97.4 /100 | #111 | Exceptional 8.6% |
| Romanians | 97.1 /100 | #112 | Exceptional 8.6% |
| Eastern Europeans | 96.8 /100 | #113 | Exceptional 8.6% |
| Immigrants | Russia | 96.7 /100 | #114 | Exceptional 8.6% |
| Argentineans | 96.5 /100 | #115 | Exceptional 8.6% |
| Zimbabweans | 96.3 /100 | #116 | Exceptional 8.6% |
| Albanians | 96.3 /100 | #117 | Exceptional 8.6% |