Immigrants from Jordan vs Ghanaian Female Unemployment
COMPARE
Immigrants from Jordan
Ghanaian
Female Unemployment
Female Unemployment Comparison
Immigrants from Jordan
Ghanaians
5.1%
FEMALE UNEMPLOYMENT
80.4/ 100
METRIC RATING
144th/ 347
METRIC RANK
5.9%
FEMALE UNEMPLOYMENT
0.0/ 100
METRIC RATING
273rd/ 347
METRIC RANK
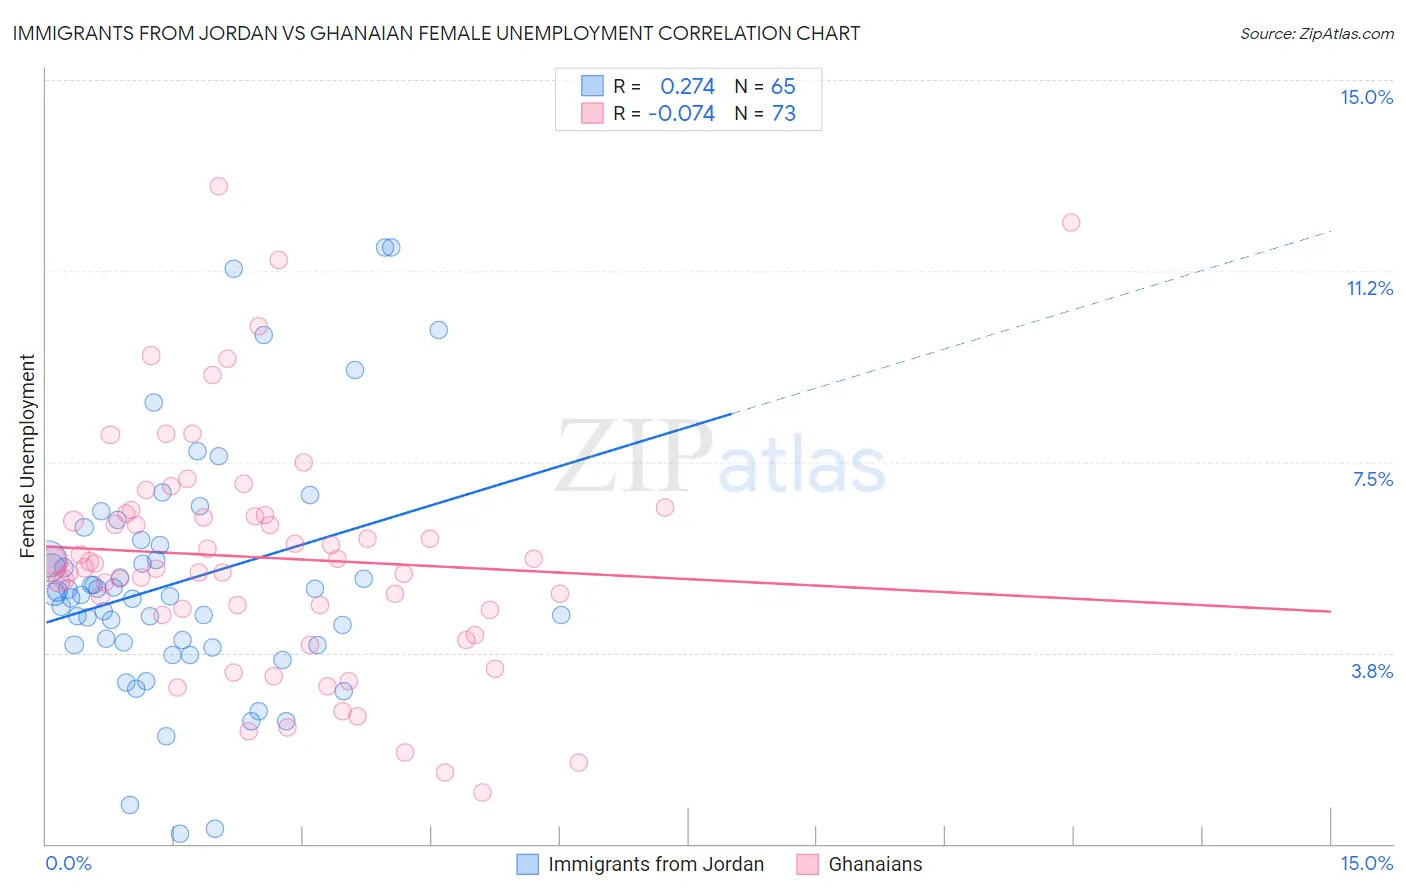
Immigrants from Jordan vs Ghanaian Female Unemployment Correlation Chart
The statistical analysis conducted on geographies consisting of 181,116,498 people shows a weak positive correlation between the proportion of Immigrants from Jordan and unemploymnet rate among females in the United States with a correlation coefficient (R) of 0.274 and weighted average of 5.1%. Similarly, the statistical analysis conducted on geographies consisting of 190,507,316 people shows a slight negative correlation between the proportion of Ghanaians and unemploymnet rate among females in the United States with a correlation coefficient (R) of -0.074 and weighted average of 5.9%, a difference of 15.5%.
Female Unemployment Correlation Summary
| Measurement | Immigrants from Jordan | Ghanaian |
| Minimum | 0.20% | 1.0% |
| Maximum | 11.7% | 12.9% |
| Range | 11.5% | 11.9% |
| Mean | 5.2% | 5.6% |
| Median | 4.9% | 5.5% |
| Interquartile 25% (IQ1) | 3.9% | 4.5% |
| Interquartile 75% (IQ3) | 5.9% | 6.5% |
| Interquartile Range (IQR) | 2.0% | 1.9% |
| Standard Deviation (Sample) | 2.4% | 2.3% |
| Standard Deviation (Population) | 2.4% | 2.3% |
Similar Demographics by Female Unemployment
Demographics Similar to Immigrants from Jordan by Female Unemployment
In terms of female unemployment, the demographic groups most similar to Immigrants from Jordan are Immigrants from Kazakhstan (5.1%, a difference of 0.030%), Palestinian (5.1%, a difference of 0.040%), Immigrants from Oceania (5.2%, a difference of 0.090%), Immigrants from Norway (5.2%, a difference of 0.10%), and Immigrants from Eastern Europe (5.1%, a difference of 0.11%).
| Demographics | Rating | Rank | Female Unemployment |
| Pakistanis | 83.8 /100 | #137 | Excellent 5.1% |
| Chickasaw | 83.2 /100 | #138 | Excellent 5.1% |
| Immigrants | Eastern Asia | 83.0 /100 | #139 | Excellent 5.1% |
| Immigrants | France | 82.7 /100 | #140 | Excellent 5.1% |
| Immigrants | Eastern Europe | 81.5 /100 | #141 | Excellent 5.1% |
| Palestinians | 80.8 /100 | #142 | Excellent 5.1% |
| Immigrants | Kazakhstan | 80.7 /100 | #143 | Excellent 5.1% |
| Immigrants | Jordan | 80.4 /100 | #144 | Excellent 5.1% |
| Immigrants | Oceania | 79.5 /100 | #145 | Good 5.2% |
| Immigrants | Norway | 79.4 /100 | #146 | Good 5.2% |
| Argentineans | 79.2 /100 | #147 | Good 5.2% |
| Immigrants | Argentina | 78.7 /100 | #148 | Good 5.2% |
| Asians | 78.3 /100 | #149 | Good 5.2% |
| Egyptians | 78.3 /100 | #150 | Good 5.2% |
| Immigrants | China | 75.9 /100 | #151 | Good 5.2% |
Demographics Similar to Ghanaians by Female Unemployment
In terms of female unemployment, the demographic groups most similar to Ghanaians are Lumbee (5.9%, a difference of 0.010%), African (5.9%, a difference of 0.080%), Central American (5.9%, a difference of 0.20%), Immigrants from Honduras (5.9%, a difference of 0.30%), and Senegalese (6.0%, a difference of 0.57%).
| Demographics | Rating | Rank | Female Unemployment |
| Cape Verdeans | 0.0 /100 | #266 | Tragic 5.9% |
| Nepalese | 0.0 /100 | #267 | Tragic 5.9% |
| Hondurans | 0.0 /100 | #268 | Tragic 5.9% |
| Immigrants | Western Africa | 0.0 /100 | #269 | Tragic 5.9% |
| Immigrants | Honduras | 0.0 /100 | #270 | Tragic 5.9% |
| Central Americans | 0.0 /100 | #271 | Tragic 5.9% |
| Lumbee | 0.0 /100 | #272 | Tragic 5.9% |
| Ghanaians | 0.0 /100 | #273 | Tragic 5.9% |
| Africans | 0.0 /100 | #274 | Tragic 5.9% |
| Senegalese | 0.0 /100 | #275 | Tragic 6.0% |
| Bahamians | 0.0 /100 | #276 | Tragic 6.0% |
| Immigrants | Ghana | 0.0 /100 | #277 | Tragic 6.0% |
| Yaqui | 0.0 /100 | #278 | Tragic 6.0% |
| Armenians | 0.0 /100 | #279 | Tragic 6.0% |
| Mexican American Indians | 0.0 /100 | #280 | Tragic 6.0% |