Immigrants from Jordan vs Lebanese Female Unemployment
COMPARE
Immigrants from Jordan
Lebanese
Female Unemployment
Female Unemployment Comparison
Immigrants from Jordan
Lebanese
5.1%
FEMALE UNEMPLOYMENT
80.4/ 100
METRIC RATING
144th/ 347
METRIC RANK
5.1%
FEMALE UNEMPLOYMENT
91.0/ 100
METRIC RATING
115th/ 347
METRIC RANK
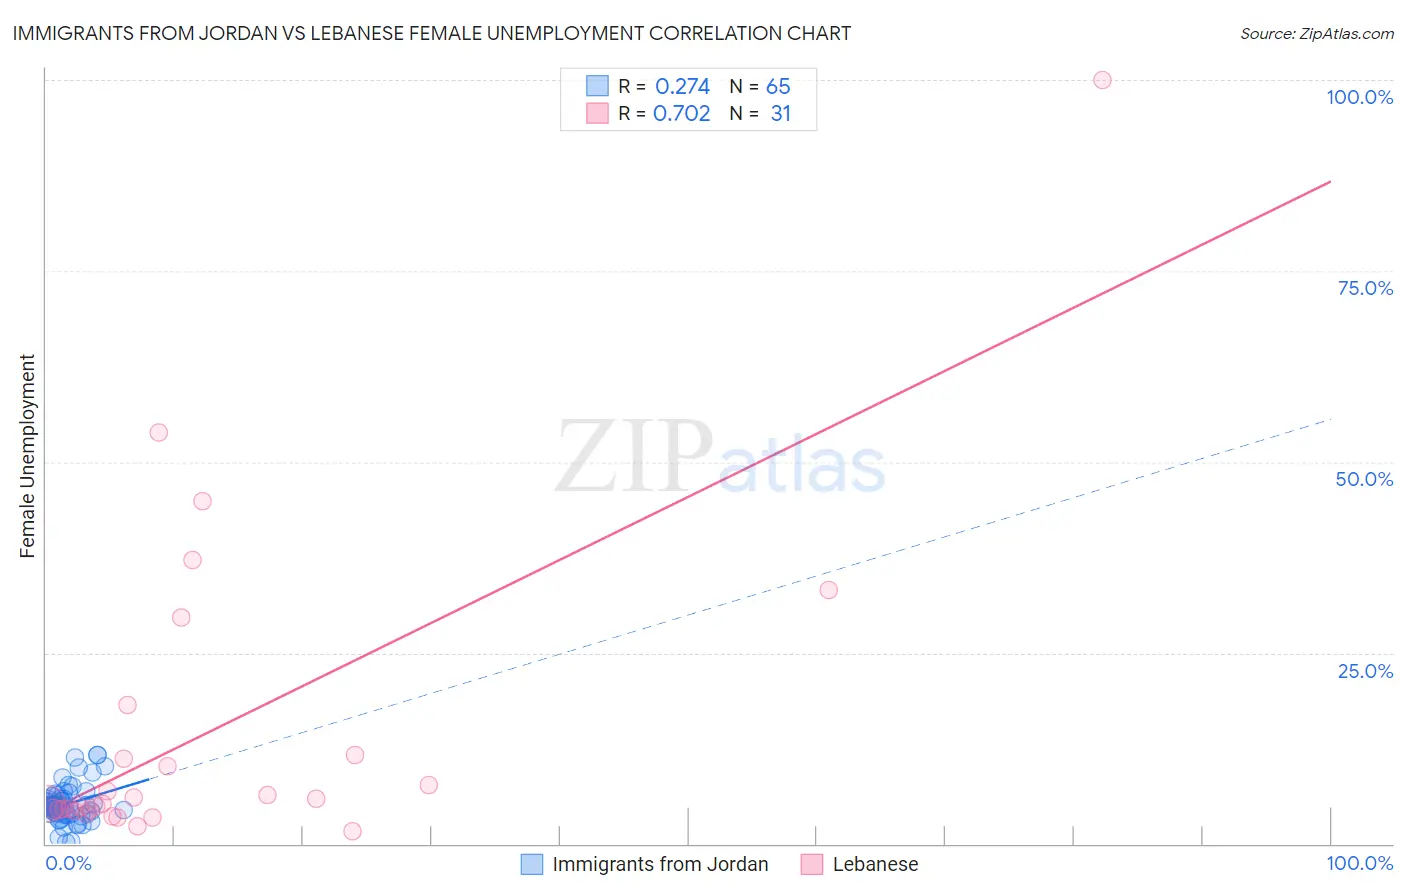
Immigrants from Jordan vs Lebanese Female Unemployment Correlation Chart
The statistical analysis conducted on geographies consisting of 181,116,498 people shows a weak positive correlation between the proportion of Immigrants from Jordan and unemploymnet rate among females in the United States with a correlation coefficient (R) of 0.274 and weighted average of 5.1%. Similarly, the statistical analysis conducted on geographies consisting of 399,531,813 people shows a strong positive correlation between the proportion of Lebanese and unemploymnet rate among females in the United States with a correlation coefficient (R) of 0.702 and weighted average of 5.1%, a difference of 1.4%.
Female Unemployment Correlation Summary
| Measurement | Immigrants from Jordan | Lebanese |
| Minimum | 0.20% | 1.6% |
| Maximum | 11.7% | 100.0% |
| Range | 11.5% | 98.4% |
| Mean | 5.2% | 14.5% |
| Median | 4.9% | 5.2% |
| Interquartile 25% (IQ1) | 3.9% | 4.4% |
| Interquartile 75% (IQ3) | 5.9% | 11.6% |
| Interquartile Range (IQR) | 2.0% | 7.2% |
| Standard Deviation (Sample) | 2.4% | 20.8% |
| Standard Deviation (Population) | 2.4% | 20.5% |
Similar Demographics by Female Unemployment
Demographics Similar to Immigrants from Jordan by Female Unemployment
In terms of female unemployment, the demographic groups most similar to Immigrants from Jordan are Immigrants from Kazakhstan (5.1%, a difference of 0.030%), Palestinian (5.1%, a difference of 0.040%), Immigrants from Oceania (5.2%, a difference of 0.090%), Immigrants from Norway (5.2%, a difference of 0.10%), and Immigrants from Eastern Europe (5.1%, a difference of 0.11%).
| Demographics | Rating | Rank | Female Unemployment |
| Pakistanis | 83.8 /100 | #137 | Excellent 5.1% |
| Chickasaw | 83.2 /100 | #138 | Excellent 5.1% |
| Immigrants | Eastern Asia | 83.0 /100 | #139 | Excellent 5.1% |
| Immigrants | France | 82.7 /100 | #140 | Excellent 5.1% |
| Immigrants | Eastern Europe | 81.5 /100 | #141 | Excellent 5.1% |
| Palestinians | 80.8 /100 | #142 | Excellent 5.1% |
| Immigrants | Kazakhstan | 80.7 /100 | #143 | Excellent 5.1% |
| Immigrants | Jordan | 80.4 /100 | #144 | Excellent 5.1% |
| Immigrants | Oceania | 79.5 /100 | #145 | Good 5.2% |
| Immigrants | Norway | 79.4 /100 | #146 | Good 5.2% |
| Argentineans | 79.2 /100 | #147 | Good 5.2% |
| Immigrants | Argentina | 78.7 /100 | #148 | Good 5.2% |
| Asians | 78.3 /100 | #149 | Good 5.2% |
| Egyptians | 78.3 /100 | #150 | Good 5.2% |
| Immigrants | China | 75.9 /100 | #151 | Good 5.2% |
Demographics Similar to Lebanese by Female Unemployment
In terms of female unemployment, the demographic groups most similar to Lebanese are Immigrants from Turkey (5.1%, a difference of 0.020%), Immigrants from Saudi Arabia (5.1%, a difference of 0.050%), American (5.1%, a difference of 0.080%), Jordanian (5.1%, a difference of 0.12%), and Immigrants from Croatia (5.1%, a difference of 0.18%).
| Demographics | Rating | Rank | Female Unemployment |
| Puget Sound Salish | 93.0 /100 | #108 | Exceptional 5.1% |
| Immigrants | Eastern Africa | 92.8 /100 | #109 | Exceptional 5.1% |
| Macedonians | 92.4 /100 | #110 | Exceptional 5.1% |
| Immigrants | Burma/Myanmar | 92.3 /100 | #111 | Exceptional 5.1% |
| Estonians | 92.1 /100 | #112 | Exceptional 5.1% |
| Immigrants | Saudi Arabia | 91.2 /100 | #113 | Exceptional 5.1% |
| Immigrants | Turkey | 91.0 /100 | #114 | Exceptional 5.1% |
| Lebanese | 91.0 /100 | #115 | Exceptional 5.1% |
| Americans | 90.5 /100 | #116 | Exceptional 5.1% |
| Jordanians | 90.3 /100 | #117 | Exceptional 5.1% |
| Immigrants | Croatia | 89.9 /100 | #118 | Excellent 5.1% |
| Immigrants | North Macedonia | 88.3 /100 | #119 | Excellent 5.1% |
| Immigrants | Romania | 88.1 /100 | #120 | Excellent 5.1% |
| Immigrants | Western Europe | 88.1 /100 | #121 | Excellent 5.1% |
| Immigrants | Germany | 87.6 /100 | #122 | Excellent 5.1% |