Immigrants from Jordan vs Marshallese 7th Grade
COMPARE
Immigrants from Jordan
Marshallese
7th Grade
7th Grade Comparison
Immigrants from Jordan
Marshallese
96.2%
7TH GRADE
77.0/ 100
METRIC RATING
155th/ 347
METRIC RANK
96.0%
7TH GRADE
48.4/ 100
METRIC RATING
178th/ 347
METRIC RANK
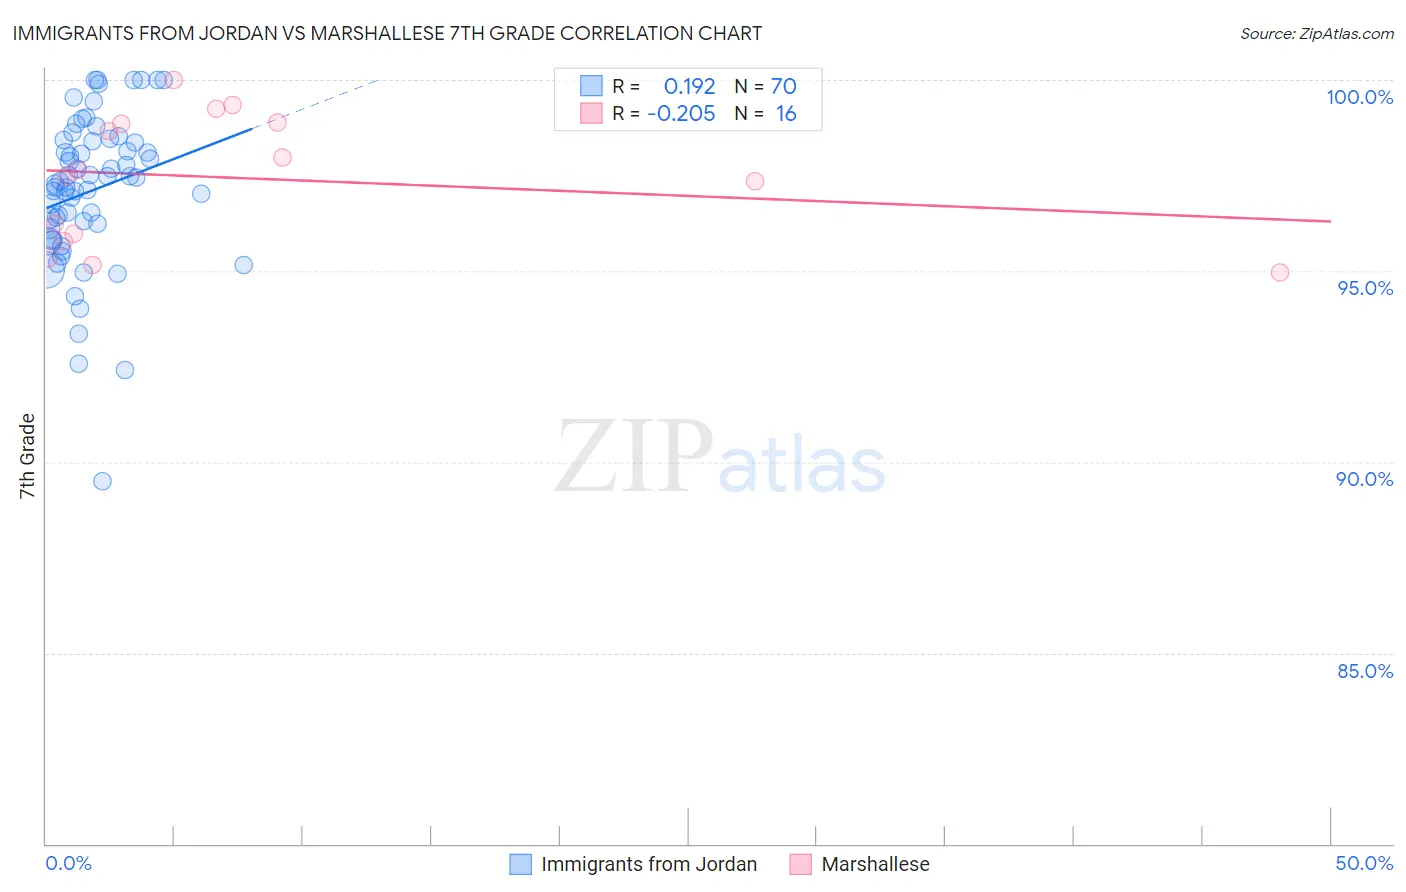
Immigrants from Jordan vs Marshallese 7th Grade Correlation Chart
The statistical analysis conducted on geographies consisting of 181,269,353 people shows a poor positive correlation between the proportion of Immigrants from Jordan and percentage of population with at least 7th grade education in the United States with a correlation coefficient (R) of 0.192 and weighted average of 96.2%. Similarly, the statistical analysis conducted on geographies consisting of 14,761,315 people shows a weak negative correlation between the proportion of Marshallese and percentage of population with at least 7th grade education in the United States with a correlation coefficient (R) of -0.205 and weighted average of 96.0%, a difference of 0.20%.
7th Grade Correlation Summary
| Measurement | Immigrants from Jordan | Marshallese |
| Minimum | 89.5% | 94.9% |
| Maximum | 100.0% | 100.0% |
| Range | 10.5% | 5.1% |
| Mean | 97.1% | 97.4% |
| Median | 97.3% | 97.6% |
| Interquartile 25% (IQ1) | 96.1% | 95.9% |
| Interquartile 75% (IQ3) | 98.4% | 98.9% |
| Interquartile Range (IQR) | 2.3% | 3.0% |
| Standard Deviation (Sample) | 2.0% | 1.7% |
| Standard Deviation (Population) | 2.0% | 1.6% |
Similar Demographics by 7th Grade
Demographics Similar to Immigrants from Jordan by 7th Grade
In terms of 7th grade, the demographic groups most similar to Immigrants from Jordan are Immigrants from Israel (96.2%, a difference of 0.0%), Immigrants from Russia (96.2%, a difference of 0.010%), Seminole (96.2%, a difference of 0.010%), Kenyan (96.2%, a difference of 0.010%), and Ugandan (96.2%, a difference of 0.010%).
| Demographics | Rating | Rank | 7th Grade |
| Israelis | 82.8 /100 | #148 | Excellent 96.3% |
| Albanians | 82.6 /100 | #149 | Excellent 96.3% |
| Immigrants | Belarus | 82.4 /100 | #150 | Excellent 96.3% |
| Hopi | 81.6 /100 | #151 | Excellent 96.3% |
| Immigrants | Russia | 78.4 /100 | #152 | Good 96.2% |
| Seminole | 78.1 /100 | #153 | Good 96.2% |
| Immigrants | Israel | 77.6 /100 | #154 | Good 96.2% |
| Immigrants | Jordan | 77.0 /100 | #155 | Good 96.2% |
| Kenyans | 76.2 /100 | #156 | Good 96.2% |
| Ugandans | 75.5 /100 | #157 | Good 96.2% |
| Arabs | 68.6 /100 | #158 | Good 96.2% |
| Alsatians | 67.2 /100 | #159 | Good 96.1% |
| Immigrants | Kenya | 66.8 /100 | #160 | Good 96.1% |
| Bermudans | 66.3 /100 | #161 | Good 96.1% |
| Pima | 64.3 /100 | #162 | Good 96.1% |
Demographics Similar to Marshallese by 7th Grade
In terms of 7th grade, the demographic groups most similar to Marshallese are Immigrants from Korea (96.0%, a difference of 0.0%), Immigrants from Iran (96.0%, a difference of 0.0%), Immigrants from Albania (96.0%, a difference of 0.010%), Mongolian (96.0%, a difference of 0.010%), and Black/African American (96.0%, a difference of 0.010%).
| Demographics | Rating | Rank | 7th Grade |
| Egyptians | 54.2 /100 | #171 | Average 96.1% |
| Venezuelans | 51.4 /100 | #172 | Average 96.0% |
| Immigrants | Albania | 50.4 /100 | #173 | Average 96.0% |
| Mongolians | 50.0 /100 | #174 | Average 96.0% |
| Blacks/African Americans | 49.5 /100 | #175 | Average 96.0% |
| Chileans | 49.3 /100 | #176 | Average 96.0% |
| Immigrants | Korea | 49.2 /100 | #177 | Average 96.0% |
| Marshallese | 48.4 /100 | #178 | Average 96.0% |
| Immigrants | Iran | 47.8 /100 | #179 | Average 96.0% |
| Immigrants | Brazil | 46.8 /100 | #180 | Average 96.0% |
| Pakistanis | 44.5 /100 | #181 | Average 96.0% |
| Iraqis | 41.2 /100 | #182 | Average 96.0% |
| Immigrants | Spain | 38.8 /100 | #183 | Fair 96.0% |
| Sierra Leoneans | 37.5 /100 | #184 | Fair 96.0% |
| Brazilians | 37.3 /100 | #185 | Fair 96.0% |