Immigrants from Jamaica vs Hispanic or Latino Unemployment Among Women with Children Ages 6 to 17 years
COMPARE
Immigrants from Jamaica
Hispanic or Latino
Unemployment Among Women with Children Ages 6 to 17 years
Unemployment Among Women with Children Ages 6 to 17 years Comparison
Immigrants from Jamaica
Hispanics or Latinos
9.5%
UNEMPLOYMENT AMONG WOMEN WITH CHILDREN AGES 6 TO 17 YEARS
0.3/ 100
METRIC RATING
266th/ 347
METRIC RANK
9.9%
UNEMPLOYMENT AMONG WOMEN WITH CHILDREN AGES 6 TO 17 YEARS
0.0/ 100
METRIC RATING
285th/ 347
METRIC RANK
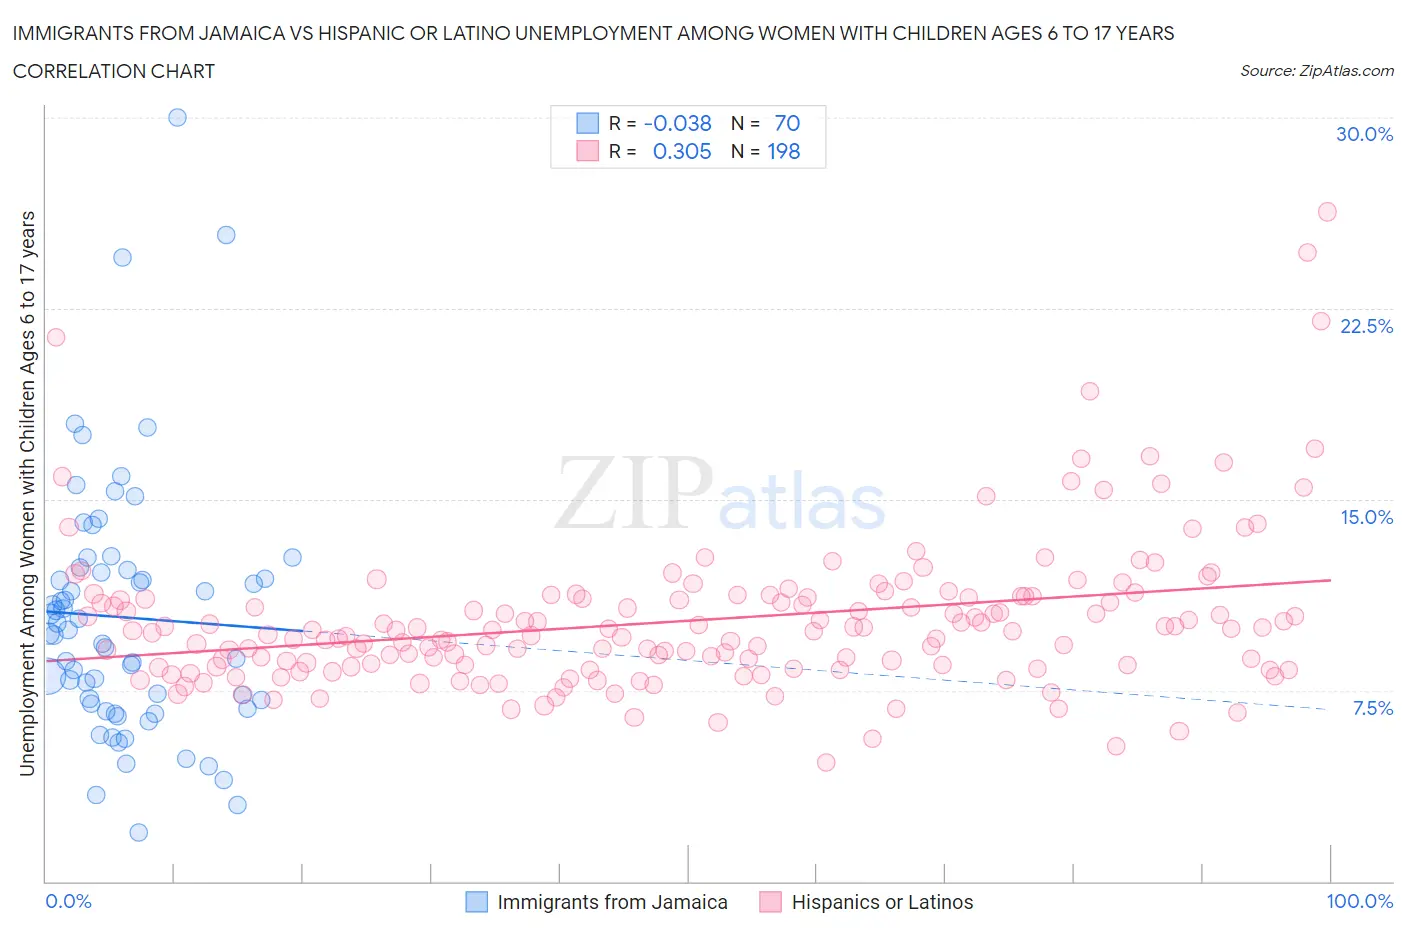
Immigrants from Jamaica vs Hispanic or Latino Unemployment Among Women with Children Ages 6 to 17 years Correlation Chart
The statistical analysis conducted on geographies consisting of 232,133,917 people shows no correlation between the proportion of Immigrants from Jamaica and unemployment rate among women with children between the ages 6 and 17 in the United States with a correlation coefficient (R) of -0.038 and weighted average of 9.5%. Similarly, the statistical analysis conducted on geographies consisting of 359,612,346 people shows a mild positive correlation between the proportion of Hispanics or Latinos and unemployment rate among women with children between the ages 6 and 17 in the United States with a correlation coefficient (R) of 0.305 and weighted average of 9.9%, a difference of 4.0%.
Unemployment Among Women with Children Ages 6 to 17 years Correlation Summary
| Measurement | Immigrants from Jamaica | Hispanic or Latino |
| Minimum | 1.9% | 4.6% |
| Maximum | 30.0% | 26.3% |
| Range | 28.1% | 21.7% |
| Mean | 10.4% | 10.2% |
| Median | 9.8% | 9.8% |
| Interquartile 25% (IQ1) | 7.0% | 8.4% |
| Interquartile 75% (IQ3) | 12.2% | 11.2% |
| Interquartile Range (IQR) | 5.3% | 2.7% |
| Standard Deviation (Sample) | 5.0% | 3.0% |
| Standard Deviation (Population) | 5.0% | 3.0% |
Demographics Similar to Immigrants from Jamaica and Hispanics or Latinos by Unemployment Among Women with Children Ages 6 to 17 years
In terms of unemployment among women with children ages 6 to 17 years, the demographic groups most similar to Immigrants from Jamaica are Irish (9.5%, a difference of 0.020%), West Indian (9.5%, a difference of 0.16%), Ghanaian (9.6%, a difference of 0.41%), Blackfeet (9.6%, a difference of 0.49%), and Immigrants from Nicaragua (9.6%, a difference of 0.59%). Similarly, the demographic groups most similar to Hispanics or Latinos are Yakama (9.9%, a difference of 0.31%), Central American Indian (9.9%, a difference of 0.46%), Slovak (9.8%, a difference of 1.3%), Jamaican (9.8%, a difference of 1.5%), and Seminole (9.7%, a difference of 2.1%).
| Demographics | Rating | Rank | Unemployment Among Women with Children Ages 6 to 17 years |
| West Indians | 0.4 /100 | #265 | Tragic 9.5% |
| Immigrants | Jamaica | 0.3 /100 | #266 | Tragic 9.5% |
| Irish | 0.3 /100 | #267 | Tragic 9.5% |
| Ghanaians | 0.2 /100 | #268 | Tragic 9.6% |
| Blackfeet | 0.2 /100 | #269 | Tragic 9.6% |
| Immigrants | Nicaragua | 0.2 /100 | #270 | Tragic 9.6% |
| Immigrants | Latin America | 0.1 /100 | #271 | Tragic 9.6% |
| Kiowa | 0.1 /100 | #272 | Tragic 9.6% |
| Whites/Caucasians | 0.1 /100 | #273 | Tragic 9.6% |
| Aleuts | 0.1 /100 | #274 | Tragic 9.6% |
| U.S. Virgin Islanders | 0.1 /100 | #275 | Tragic 9.7% |
| Immigrants | Portugal | 0.1 /100 | #276 | Tragic 9.7% |
| British West Indians | 0.1 /100 | #277 | Tragic 9.7% |
| French | 0.1 /100 | #278 | Tragic 9.7% |
| Scotch-Irish | 0.1 /100 | #279 | Tragic 9.7% |
| Seminole | 0.1 /100 | #280 | Tragic 9.7% |
| Jamaicans | 0.0 /100 | #281 | Tragic 9.8% |
| Slovaks | 0.0 /100 | #282 | Tragic 9.8% |
| Central American Indians | 0.0 /100 | #283 | Tragic 9.9% |
| Yakama | 0.0 /100 | #284 | Tragic 9.9% |
| Hispanics or Latinos | 0.0 /100 | #285 | Tragic 9.9% |