Immigrants from Hungary vs Pueblo Male Unemployment
COMPARE
Immigrants from Hungary
Pueblo
Male Unemployment
Male Unemployment Comparison
Immigrants from Hungary
Pueblo
5.2%
MALE UNEMPLOYMENT
73.4/ 100
METRIC RATING
155th/ 347
METRIC RANK
8.5%
MALE UNEMPLOYMENT
0.0/ 100
METRIC RATING
335th/ 347
METRIC RANK
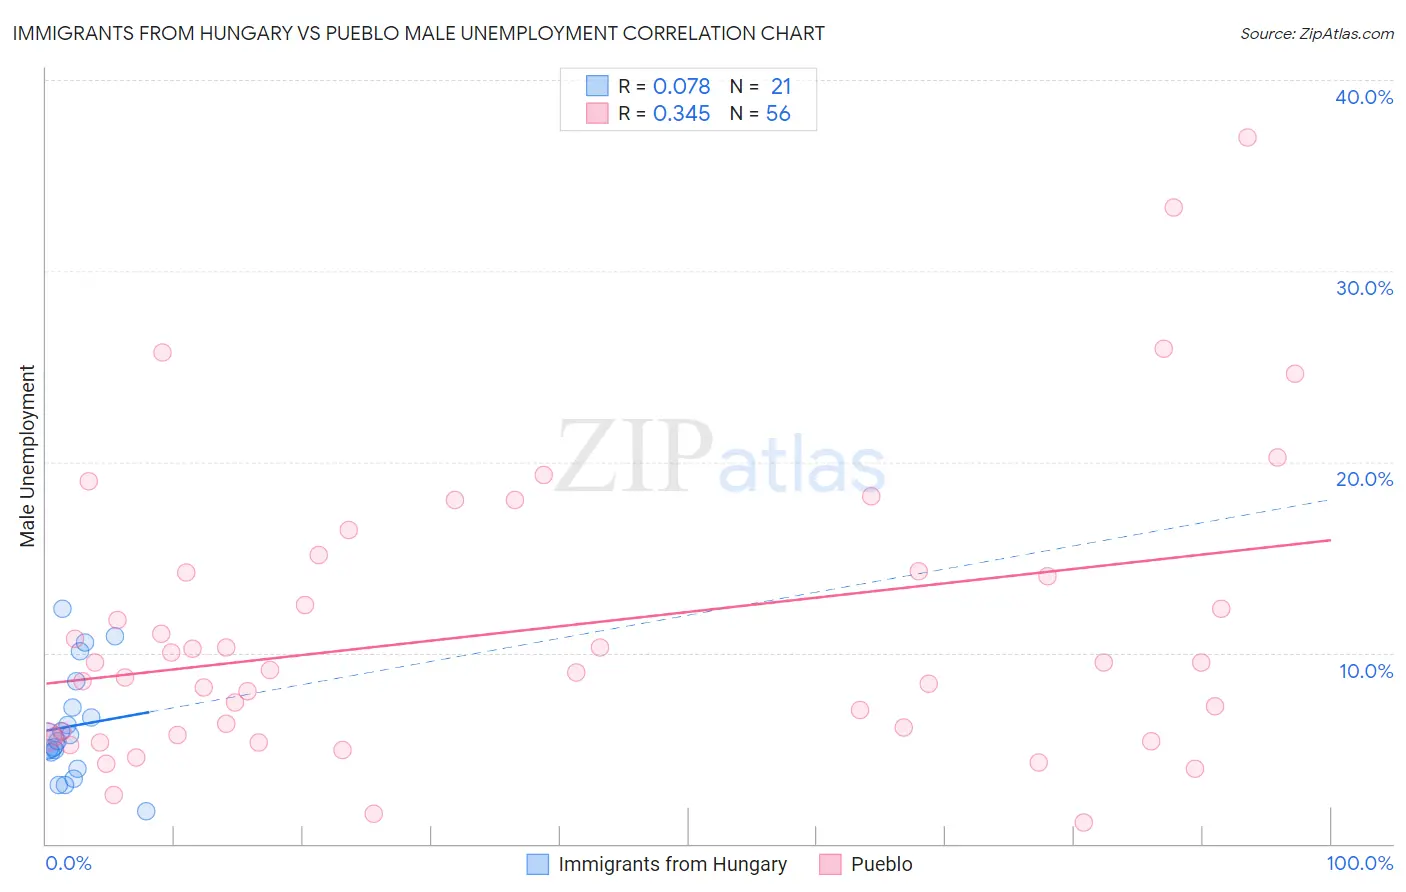
Immigrants from Hungary vs Pueblo Male Unemployment Correlation Chart
The statistical analysis conducted on geographies consisting of 195,412,330 people shows a slight positive correlation between the proportion of Immigrants from Hungary and unemployment rate among males in the United States with a correlation coefficient (R) of 0.078 and weighted average of 5.2%. Similarly, the statistical analysis conducted on geographies consisting of 119,915,032 people shows a mild positive correlation between the proportion of Pueblo and unemployment rate among males in the United States with a correlation coefficient (R) of 0.345 and weighted average of 8.5%, a difference of 62.3%.
Male Unemployment Correlation Summary
| Measurement | Immigrants from Hungary | Pueblo |
| Minimum | 1.7% | 1.1% |
| Maximum | 12.3% | 37.0% |
| Range | 10.6% | 35.9% |
| Mean | 6.2% | 11.2% |
| Median | 5.4% | 9.3% |
| Interquartile 25% (IQ1) | 4.4% | 5.7% |
| Interquartile 75% (IQ3) | 7.8% | 14.3% |
| Interquartile Range (IQR) | 3.5% | 8.6% |
| Standard Deviation (Sample) | 2.8% | 7.5% |
| Standard Deviation (Population) | 2.8% | 7.4% |
Similar Demographics by Male Unemployment
Demographics Similar to Immigrants from Hungary by Male Unemployment
In terms of male unemployment, the demographic groups most similar to Immigrants from Hungary are Laotian (5.2%, a difference of 0.030%), Immigrants from Uruguay (5.2%, a difference of 0.040%), American (5.2%, a difference of 0.060%), Immigrants from Northern Africa (5.2%, a difference of 0.080%), and Egyptian (5.2%, a difference of 0.11%).
| Demographics | Rating | Rank | Male Unemployment |
| Immigrants | Italy | 76.3 /100 | #148 | Good 5.2% |
| Immigrants | Europe | 76.2 /100 | #149 | Good 5.2% |
| Indians (Asian) | 76.0 /100 | #150 | Good 5.2% |
| Slovaks | 75.5 /100 | #151 | Good 5.2% |
| Egyptians | 74.8 /100 | #152 | Good 5.2% |
| Immigrants | Uruguay | 73.9 /100 | #153 | Good 5.2% |
| Laotians | 73.8 /100 | #154 | Good 5.2% |
| Immigrants | Hungary | 73.4 /100 | #155 | Good 5.2% |
| Americans | 72.7 /100 | #156 | Good 5.2% |
| Immigrants | Northern Africa | 72.3 /100 | #157 | Good 5.2% |
| Immigrants | Indonesia | 71.5 /100 | #158 | Good 5.2% |
| Indonesians | 71.2 /100 | #159 | Good 5.2% |
| Immigrants | Norway | 71.0 /100 | #160 | Good 5.2% |
| Immigrants | China | 70.6 /100 | #161 | Good 5.2% |
| Immigrants | Egypt | 65.9 /100 | #162 | Good 5.2% |
Demographics Similar to Pueblo by Male Unemployment
In terms of male unemployment, the demographic groups most similar to Pueblo are Tsimshian (8.5%, a difference of 0.060%), Sioux (8.4%, a difference of 1.0%), Yuman (8.6%, a difference of 1.4%), Puerto Rican (8.6%, a difference of 1.4%), and Apache (8.6%, a difference of 1.6%).
| Demographics | Rating | Rank | Male Unemployment |
| Natives/Alaskans | 0.0 /100 | #328 | Tragic 7.7% |
| Immigrants | Yemen | 0.0 /100 | #329 | Tragic 7.8% |
| Yakama | 0.0 /100 | #330 | Tragic 7.9% |
| Alaska Natives | 0.0 /100 | #331 | Tragic 8.1% |
| Pima | 0.0 /100 | #332 | Tragic 8.3% |
| Sioux | 0.0 /100 | #333 | Tragic 8.4% |
| Tsimshian | 0.0 /100 | #334 | Tragic 8.5% |
| Pueblo | 0.0 /100 | #335 | Tragic 8.5% |
| Yuman | 0.0 /100 | #336 | Tragic 8.6% |
| Puerto Ricans | 0.0 /100 | #337 | Tragic 8.6% |
| Apache | 0.0 /100 | #338 | Tragic 8.6% |
| Cheyenne | 0.0 /100 | #339 | Tragic 9.8% |
| Alaskan Athabascans | 0.0 /100 | #340 | Tragic 9.8% |
| Navajo | 0.0 /100 | #341 | Tragic 9.8% |
| Tohono O'odham | 0.0 /100 | #342 | Tragic 10.2% |