Immigrants from Honduras vs Celtic Unemployment
COMPARE
Immigrants from Honduras
Celtic
Unemployment
Unemployment Comparison
Immigrants from Honduras
Celtics
5.7%
UNEMPLOYMENT
0.3/ 100
METRIC RATING
254th/ 347
METRIC RANK
4.9%
UNEMPLOYMENT
99.1/ 100
METRIC RATING
56th/ 347
METRIC RANK
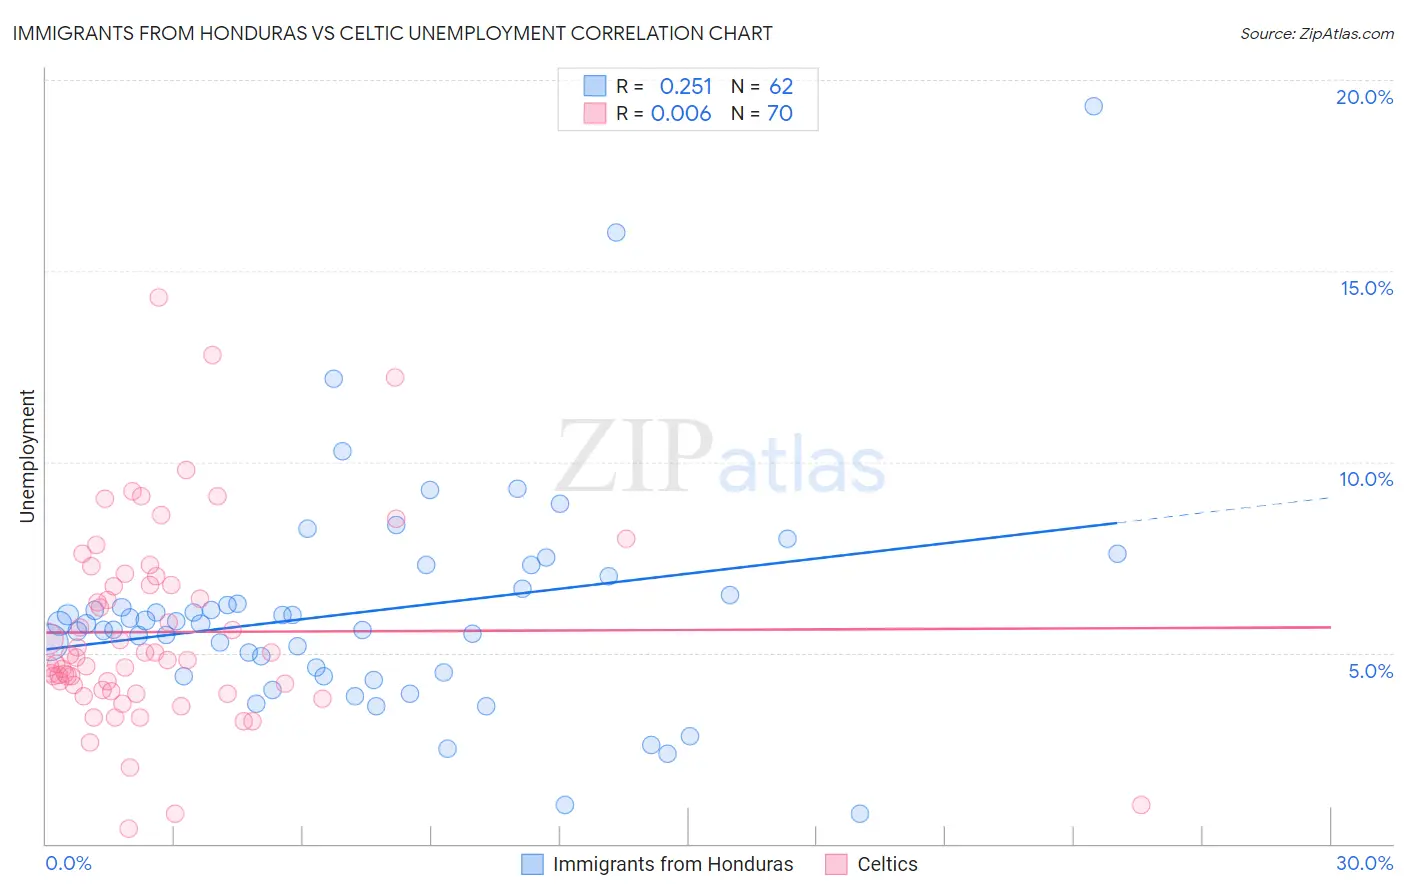
Immigrants from Honduras vs Celtic Unemployment Correlation Chart
The statistical analysis conducted on geographies consisting of 322,382,212 people shows a weak positive correlation between the proportion of Immigrants from Honduras and unemployment in the United States with a correlation coefficient (R) of 0.251 and weighted average of 5.7%. Similarly, the statistical analysis conducted on geographies consisting of 168,747,363 people shows no correlation between the proportion of Celtics and unemployment in the United States with a correlation coefficient (R) of 0.006 and weighted average of 4.9%, a difference of 17.3%.
Unemployment Correlation Summary
| Measurement | Immigrants from Honduras | Celtic |
| Minimum | 0.80% | 0.40% |
| Maximum | 19.3% | 14.3% |
| Range | 18.5% | 13.9% |
| Mean | 6.1% | 5.5% |
| Median | 5.8% | 4.8% |
| Interquartile 25% (IQ1) | 4.5% | 4.0% |
| Interquartile 75% (IQ3) | 6.7% | 6.8% |
| Interquartile Range (IQR) | 2.2% | 2.8% |
| Standard Deviation (Sample) | 3.0% | 2.6% |
| Standard Deviation (Population) | 2.9% | 2.6% |
Similar Demographics by Unemployment
Demographics Similar to Immigrants from Honduras by Unemployment
In terms of unemployment, the demographic groups most similar to Immigrants from Honduras are Central American (5.7%, a difference of 0.070%), Honduran (5.7%, a difference of 0.080%), Immigrants from Portugal (5.7%, a difference of 0.44%), Guatemalan (5.8%, a difference of 0.65%), and Kiowa (5.7%, a difference of 0.83%).
| Demographics | Rating | Rank | Unemployment |
| Immigrants | Cameroon | 1.0 /100 | #247 | Tragic 5.6% |
| Liberians | 0.9 /100 | #248 | Tragic 5.6% |
| Cajuns | 0.8 /100 | #249 | Tragic 5.6% |
| Japanese | 0.8 /100 | #250 | Tragic 5.6% |
| Kiowa | 0.6 /100 | #251 | Tragic 5.7% |
| Hondurans | 0.3 /100 | #252 | Tragic 5.7% |
| Central Americans | 0.3 /100 | #253 | Tragic 5.7% |
| Immigrants | Honduras | 0.3 /100 | #254 | Tragic 5.7% |
| Immigrants | Portugal | 0.2 /100 | #255 | Tragic 5.7% |
| Guatemalans | 0.2 /100 | #256 | Tragic 5.8% |
| Yaqui | 0.2 /100 | #257 | Tragic 5.8% |
| Immigrants | Bahamas | 0.1 /100 | #258 | Tragic 5.8% |
| Sub-Saharan Africans | 0.1 /100 | #259 | Tragic 5.8% |
| Immigrants | Uzbekistan | 0.1 /100 | #260 | Tragic 5.8% |
| Immigrants | Guatemala | 0.1 /100 | #261 | Tragic 5.8% |
Demographics Similar to Celtics by Unemployment
In terms of unemployment, the demographic groups most similar to Celtics are Immigrants from Singapore (4.9%, a difference of 0.070%), Australian (4.9%, a difference of 0.16%), Greek (4.9%, a difference of 0.17%), Eastern European (4.9%, a difference of 0.19%), and Bhutanese (4.9%, a difference of 0.20%).
| Demographics | Rating | Rank | Unemployment |
| Immigrants | South Central Asia | 99.3 /100 | #49 | Exceptional 4.9% |
| French Canadians | 99.3 /100 | #50 | Exceptional 4.9% |
| Immigrants | Belgium | 99.2 /100 | #51 | Exceptional 4.9% |
| Whites/Caucasians | 99.2 /100 | #52 | Exceptional 4.9% |
| Immigrants | Zimbabwe | 99.2 /100 | #53 | Exceptional 4.9% |
| Eastern Europeans | 99.2 /100 | #54 | Exceptional 4.9% |
| Australians | 99.2 /100 | #55 | Exceptional 4.9% |
| Celtics | 99.1 /100 | #56 | Exceptional 4.9% |
| Immigrants | Singapore | 99.1 /100 | #57 | Exceptional 4.9% |
| Greeks | 99.0 /100 | #58 | Exceptional 4.9% |
| Bhutanese | 99.0 /100 | #59 | Exceptional 4.9% |
| Immigrants | Netherlands | 99.0 /100 | #60 | Exceptional 4.9% |
| Cambodians | 99.0 /100 | #61 | Exceptional 4.9% |
| Icelanders | 98.9 /100 | #62 | Exceptional 4.9% |
| Immigrants | Bulgaria | 98.9 /100 | #63 | Exceptional 4.9% |