Immigrants from Honduras vs Celtic Currently Married
COMPARE
Immigrants from Honduras
Celtic
Currently Married
Currently Married Comparison
Immigrants from Honduras
Celtics
42.2%
CURRENTLY MARRIED
0.0/ 100
METRIC RATING
298th/ 347
METRIC RANK
47.8%
CURRENTLY MARRIED
94.2/ 100
METRIC RATING
100th/ 347
METRIC RANK
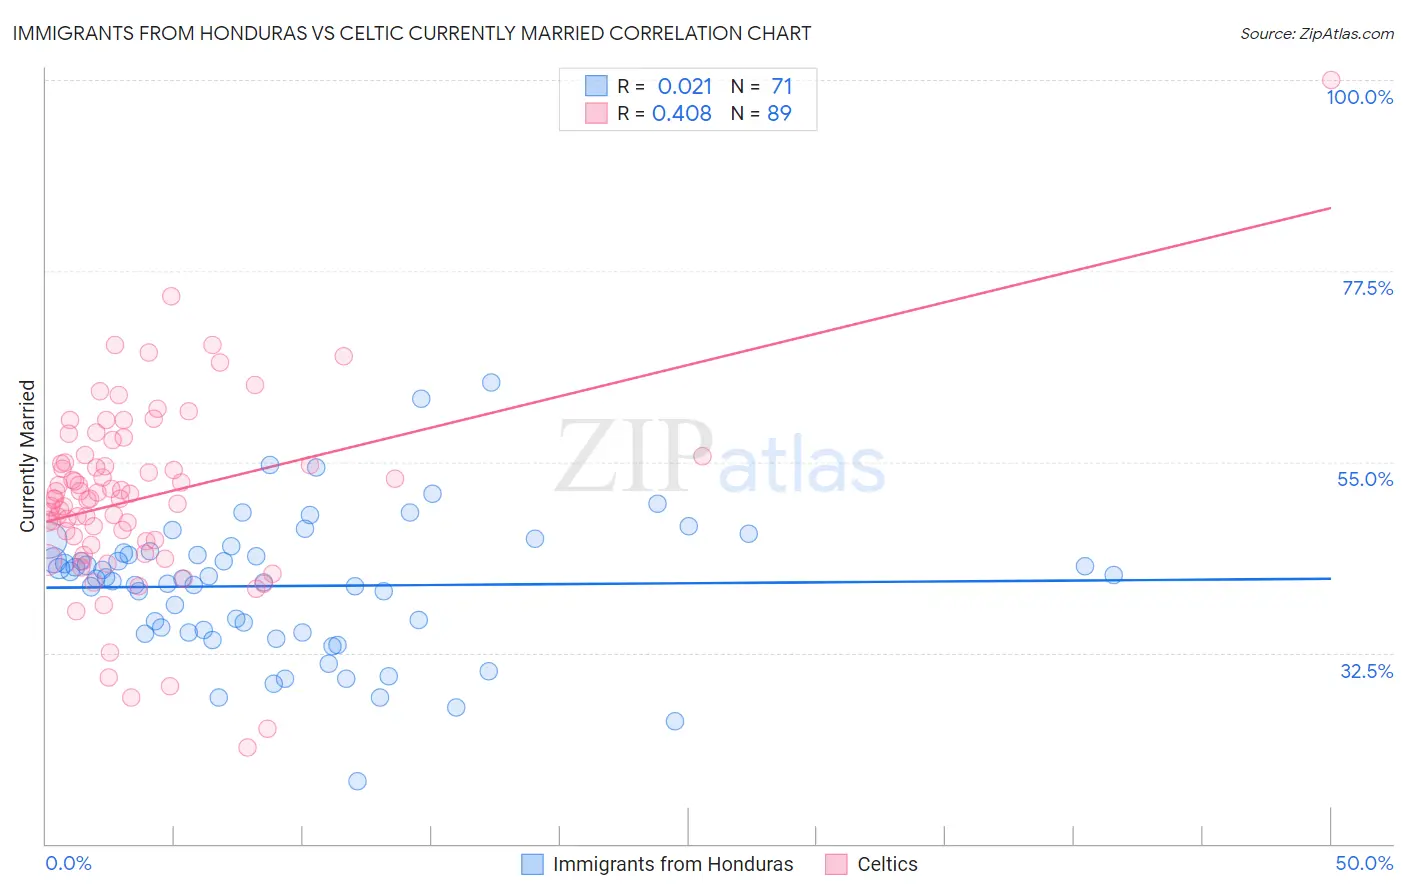
Immigrants from Honduras vs Celtic Currently Married Correlation Chart
The statistical analysis conducted on geographies consisting of 322,599,872 people shows no correlation between the proportion of Immigrants from Honduras and percentage of population currently married in the United States with a correlation coefficient (R) of 0.021 and weighted average of 42.2%. Similarly, the statistical analysis conducted on geographies consisting of 168,877,326 people shows a moderate positive correlation between the proportion of Celtics and percentage of population currently married in the United States with a correlation coefficient (R) of 0.408 and weighted average of 47.8%, a difference of 13.3%.
Currently Married Correlation Summary
| Measurement | Immigrants from Honduras | Celtic |
| Minimum | 17.3% | 21.4% |
| Maximum | 64.4% | 100.0% |
| Range | 47.1% | 78.6% |
| Mean | 40.4% | 50.8% |
| Median | 41.2% | 50.7% |
| Interquartile 25% (IQ1) | 34.9% | 45.4% |
| Interquartile 75% (IQ3) | 44.3% | 55.2% |
| Interquartile Range (IQR) | 9.3% | 9.8% |
| Standard Deviation (Sample) | 8.2% | 11.1% |
| Standard Deviation (Population) | 8.1% | 11.0% |
Similar Demographics by Currently Married
Demographics Similar to Immigrants from Honduras by Currently Married
In terms of currently married, the demographic groups most similar to Immigrants from Honduras are Liberian (42.2%, a difference of 0.030%), Cheyenne (42.2%, a difference of 0.090%), Belizean (42.2%, a difference of 0.13%), Menominee (42.3%, a difference of 0.20%), and Immigrants from Yemen (42.1%, a difference of 0.37%).
| Demographics | Rating | Rank | Currently Married |
| Immigrants | Guatemala | 0.0 /100 | #291 | Tragic 42.6% |
| Sub-Saharan Africans | 0.0 /100 | #292 | Tragic 42.6% |
| Yuman | 0.0 /100 | #293 | Tragic 42.6% |
| Hondurans | 0.0 /100 | #294 | Tragic 42.5% |
| Immigrants | Western Africa | 0.0 /100 | #295 | Tragic 42.4% |
| Menominee | 0.0 /100 | #296 | Tragic 42.3% |
| Cheyenne | 0.0 /100 | #297 | Tragic 42.2% |
| Immigrants | Honduras | 0.0 /100 | #298 | Tragic 42.2% |
| Liberians | 0.0 /100 | #299 | Tragic 42.2% |
| Belizeans | 0.0 /100 | #300 | Tragic 42.2% |
| Immigrants | Yemen | 0.0 /100 | #301 | Tragic 42.1% |
| Immigrants | Zaire | 0.0 /100 | #302 | Tragic 42.0% |
| Sioux | 0.0 /100 | #303 | Tragic 41.9% |
| Immigrants | Bahamas | 0.0 /100 | #304 | Tragic 41.9% |
| Immigrants | Trinidad and Tobago | 0.0 /100 | #305 | Tragic 41.9% |
Demographics Similar to Celtics by Currently Married
In terms of currently married, the demographic groups most similar to Celtics are Immigrants from Sweden (47.8%, a difference of 0.020%), Immigrants from Germany (47.8%, a difference of 0.020%), Turkish (47.8%, a difference of 0.040%), Cypriot (47.8%, a difference of 0.070%), and Serbian (47.8%, a difference of 0.080%).
| Demographics | Rating | Rank | Currently Married |
| Lebanese | 95.1 /100 | #93 | Exceptional 47.9% |
| Native Hawaiians | 95.0 /100 | #94 | Exceptional 47.9% |
| Immigrants | Bulgaria | 94.8 /100 | #95 | Exceptional 47.9% |
| Egyptians | 94.8 /100 | #96 | Exceptional 47.9% |
| Immigrants | Ukraine | 94.8 /100 | #97 | Exceptional 47.9% |
| Immigrants | China | 94.7 /100 | #98 | Exceptional 47.9% |
| Immigrants | Sweden | 94.3 /100 | #99 | Exceptional 47.8% |
| Celtics | 94.2 /100 | #100 | Exceptional 47.8% |
| Immigrants | Germany | 94.1 /100 | #101 | Exceptional 47.8% |
| Turks | 93.9 /100 | #102 | Exceptional 47.8% |
| Cypriots | 93.7 /100 | #103 | Exceptional 47.8% |
| Serbians | 93.6 /100 | #104 | Exceptional 47.8% |
| Immigrants | Singapore | 93.3 /100 | #105 | Exceptional 47.8% |
| Immigrants | Greece | 93.1 /100 | #106 | Exceptional 47.7% |
| Immigrants | Italy | 92.9 /100 | #107 | Exceptional 47.7% |