Dutch West Indian vs Celtic Unemployment
COMPARE
Dutch West Indian
Celtic
Unemployment
Unemployment Comparison
Dutch West Indians
Celtics
5.6%
UNEMPLOYMENT
1.2/ 100
METRIC RATING
244th/ 347
METRIC RANK
4.9%
UNEMPLOYMENT
99.1/ 100
METRIC RATING
56th/ 347
METRIC RANK
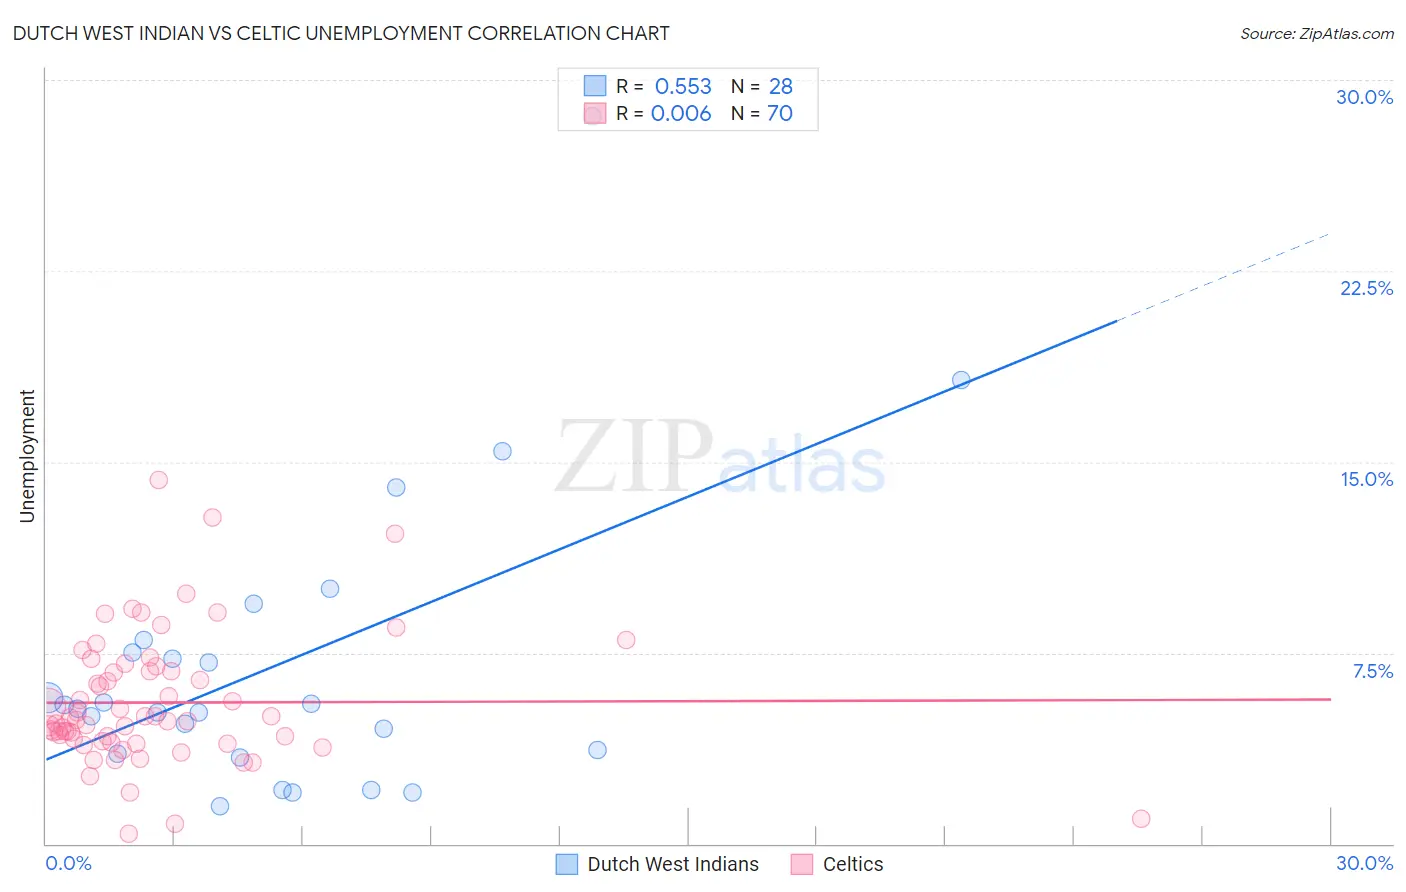
Dutch West Indian vs Celtic Unemployment Correlation Chart
The statistical analysis conducted on geographies consisting of 85,705,880 people shows a substantial positive correlation between the proportion of Dutch West Indians and unemployment in the United States with a correlation coefficient (R) of 0.553 and weighted average of 5.6%. Similarly, the statistical analysis conducted on geographies consisting of 168,747,363 people shows no correlation between the proportion of Celtics and unemployment in the United States with a correlation coefficient (R) of 0.006 and weighted average of 4.9%, a difference of 15.1%.
Unemployment Correlation Summary
| Measurement | Dutch West Indian | Celtic |
| Minimum | 1.5% | 0.40% |
| Maximum | 28.6% | 14.3% |
| Range | 27.1% | 13.9% |
| Mean | 7.1% | 5.5% |
| Median | 5.4% | 4.8% |
| Interquartile 25% (IQ1) | 3.6% | 4.0% |
| Interquartile 75% (IQ3) | 7.8% | 6.8% |
| Interquartile Range (IQR) | 4.1% | 2.8% |
| Standard Deviation (Sample) | 5.9% | 2.6% |
| Standard Deviation (Population) | 5.7% | 2.6% |
Similar Demographics by Unemployment
Demographics Similar to Dutch West Indians by Unemployment
In terms of unemployment, the demographic groups most similar to Dutch West Indians are French American Indian (5.6%, a difference of 0.020%), Bermudan (5.6%, a difference of 0.070%), Marshallese (5.6%, a difference of 0.15%), Immigrants from Cameroon (5.6%, a difference of 0.21%), and Liberian (5.6%, a difference of 0.34%).
| Demographics | Rating | Rank | Unemployment |
| Moroccans | 3.2 /100 | #237 | Tragic 5.5% |
| Immigrants | Western Asia | 2.8 /100 | #238 | Tragic 5.5% |
| Immigrants | Immigrants | 2.6 /100 | #239 | Tragic 5.5% |
| Cree | 2.6 /100 | #240 | Tragic 5.6% |
| Tlingit-Haida | 2.0 /100 | #241 | Tragic 5.6% |
| Spanish Americans | 2.0 /100 | #242 | Tragic 5.6% |
| Marshallese | 1.3 /100 | #243 | Tragic 5.6% |
| Dutch West Indians | 1.2 /100 | #244 | Tragic 5.6% |
| French American Indians | 1.2 /100 | #245 | Tragic 5.6% |
| Bermudans | 1.1 /100 | #246 | Tragic 5.6% |
| Immigrants | Cameroon | 1.0 /100 | #247 | Tragic 5.6% |
| Liberians | 0.9 /100 | #248 | Tragic 5.6% |
| Cajuns | 0.8 /100 | #249 | Tragic 5.6% |
| Japanese | 0.8 /100 | #250 | Tragic 5.6% |
| Kiowa | 0.6 /100 | #251 | Tragic 5.7% |
Demographics Similar to Celtics by Unemployment
In terms of unemployment, the demographic groups most similar to Celtics are Immigrants from Singapore (4.9%, a difference of 0.070%), Australian (4.9%, a difference of 0.16%), Greek (4.9%, a difference of 0.17%), Eastern European (4.9%, a difference of 0.19%), and Bhutanese (4.9%, a difference of 0.20%).
| Demographics | Rating | Rank | Unemployment |
| Immigrants | South Central Asia | 99.3 /100 | #49 | Exceptional 4.9% |
| French Canadians | 99.3 /100 | #50 | Exceptional 4.9% |
| Immigrants | Belgium | 99.2 /100 | #51 | Exceptional 4.9% |
| Whites/Caucasians | 99.2 /100 | #52 | Exceptional 4.9% |
| Immigrants | Zimbabwe | 99.2 /100 | #53 | Exceptional 4.9% |
| Eastern Europeans | 99.2 /100 | #54 | Exceptional 4.9% |
| Australians | 99.2 /100 | #55 | Exceptional 4.9% |
| Celtics | 99.1 /100 | #56 | Exceptional 4.9% |
| Immigrants | Singapore | 99.1 /100 | #57 | Exceptional 4.9% |
| Greeks | 99.0 /100 | #58 | Exceptional 4.9% |
| Bhutanese | 99.0 /100 | #59 | Exceptional 4.9% |
| Immigrants | Netherlands | 99.0 /100 | #60 | Exceptional 4.9% |
| Cambodians | 99.0 /100 | #61 | Exceptional 4.9% |
| Icelanders | 98.9 /100 | #62 | Exceptional 4.9% |
| Immigrants | Bulgaria | 98.9 /100 | #63 | Exceptional 4.9% |