Immigrants from Caribbean vs Celtic Unemployment
COMPARE
Immigrants from Caribbean
Celtic
Unemployment
Unemployment Comparison
Immigrants from Caribbean
Celtics
6.2%
UNEMPLOYMENT
0.0/ 100
METRIC RATING
286th/ 347
METRIC RANK
4.9%
UNEMPLOYMENT
99.1/ 100
METRIC RATING
56th/ 347
METRIC RANK
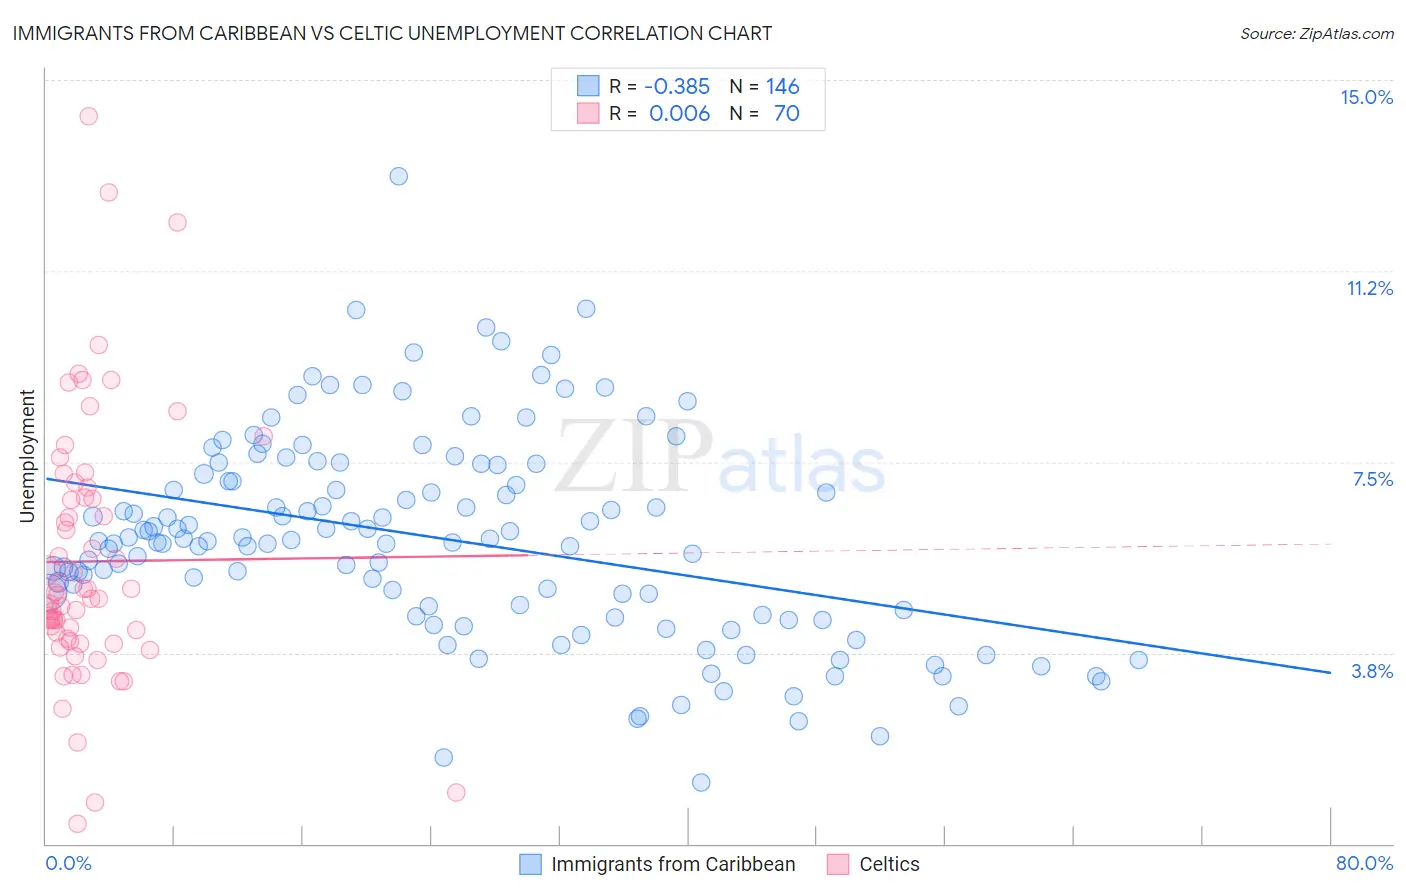
Immigrants from Caribbean vs Celtic Unemployment Correlation Chart
The statistical analysis conducted on geographies consisting of 449,366,632 people shows a mild negative correlation between the proportion of Immigrants from Caribbean and unemployment in the United States with a correlation coefficient (R) of -0.385 and weighted average of 6.2%. Similarly, the statistical analysis conducted on geographies consisting of 168,747,363 people shows no correlation between the proportion of Celtics and unemployment in the United States with a correlation coefficient (R) of 0.006 and weighted average of 4.9%, a difference of 26.1%.
Unemployment Correlation Summary
| Measurement | Immigrants from Caribbean | Celtic |
| Minimum | 1.2% | 0.40% |
| Maximum | 13.1% | 14.3% |
| Range | 11.9% | 13.9% |
| Mean | 6.0% | 5.5% |
| Median | 6.0% | 4.8% |
| Interquartile 25% (IQ1) | 4.6% | 4.0% |
| Interquartile 75% (IQ3) | 7.3% | 6.8% |
| Interquartile Range (IQR) | 2.7% | 2.8% |
| Standard Deviation (Sample) | 2.0% | 2.6% |
| Standard Deviation (Population) | 2.0% | 2.6% |
Similar Demographics by Unemployment
Demographics Similar to Immigrants from Caribbean by Unemployment
In terms of unemployment, the demographic groups most similar to Immigrants from Caribbean are Nepalese (6.2%, a difference of 0.33%), Ecuadorian (6.2%, a difference of 0.36%), Immigrants from Senegal (6.1%, a difference of 0.43%), Chippewa (6.2%, a difference of 0.71%), and Senegalese (6.2%, a difference of 0.80%).
| Demographics | Rating | Rank | Unemployment |
| Immigrants | Mexico | 0.0 /100 | #279 | Tragic 6.0% |
| Immigrants | Western Africa | 0.0 /100 | #280 | Tragic 6.0% |
| Africans | 0.0 /100 | #281 | Tragic 6.1% |
| Immigrants | Azores | 0.0 /100 | #282 | Tragic 6.1% |
| Immigrants | Ghana | 0.0 /100 | #283 | Tragic 6.1% |
| Aleuts | 0.0 /100 | #284 | Tragic 6.1% |
| Immigrants | Senegal | 0.0 /100 | #285 | Tragic 6.1% |
| Immigrants | Caribbean | 0.0 /100 | #286 | Tragic 6.2% |
| Nepalese | 0.0 /100 | #287 | Tragic 6.2% |
| Ecuadorians | 0.0 /100 | #288 | Tragic 6.2% |
| Chippewa | 0.0 /100 | #289 | Tragic 6.2% |
| Senegalese | 0.0 /100 | #290 | Tragic 6.2% |
| Haitians | 0.0 /100 | #291 | Tragic 6.2% |
| Central American Indians | 0.0 /100 | #292 | Tragic 6.2% |
| Immigrants | Ecuador | 0.0 /100 | #293 | Tragic 6.2% |
Demographics Similar to Celtics by Unemployment
In terms of unemployment, the demographic groups most similar to Celtics are Immigrants from Singapore (4.9%, a difference of 0.070%), Australian (4.9%, a difference of 0.16%), Greek (4.9%, a difference of 0.17%), Eastern European (4.9%, a difference of 0.19%), and Bhutanese (4.9%, a difference of 0.20%).
| Demographics | Rating | Rank | Unemployment |
| Immigrants | South Central Asia | 99.3 /100 | #49 | Exceptional 4.9% |
| French Canadians | 99.3 /100 | #50 | Exceptional 4.9% |
| Immigrants | Belgium | 99.2 /100 | #51 | Exceptional 4.9% |
| Whites/Caucasians | 99.2 /100 | #52 | Exceptional 4.9% |
| Immigrants | Zimbabwe | 99.2 /100 | #53 | Exceptional 4.9% |
| Eastern Europeans | 99.2 /100 | #54 | Exceptional 4.9% |
| Australians | 99.2 /100 | #55 | Exceptional 4.9% |
| Celtics | 99.1 /100 | #56 | Exceptional 4.9% |
| Immigrants | Singapore | 99.1 /100 | #57 | Exceptional 4.9% |
| Greeks | 99.0 /100 | #58 | Exceptional 4.9% |
| Bhutanese | 99.0 /100 | #59 | Exceptional 4.9% |
| Immigrants | Netherlands | 99.0 /100 | #60 | Exceptional 4.9% |
| Cambodians | 99.0 /100 | #61 | Exceptional 4.9% |
| Icelanders | 98.9 /100 | #62 | Exceptional 4.9% |
| Immigrants | Bulgaria | 98.9 /100 | #63 | Exceptional 4.9% |