Immigrants from Haiti vs Yakama In Labor Force | Age 30-34
COMPARE
Immigrants from Haiti
Yakama
In Labor Force | Age 30-34
In Labor Force | Age 30-34 Comparison
Immigrants from Haiti
Yakama
84.2%
IN LABOR FORCE | AGE 30-34
2.8/ 100
METRIC RATING
228th/ 347
METRIC RANK
79.1%
IN LABOR FORCE | AGE 30-34
0.0/ 100
METRIC RATING
337th/ 347
METRIC RANK
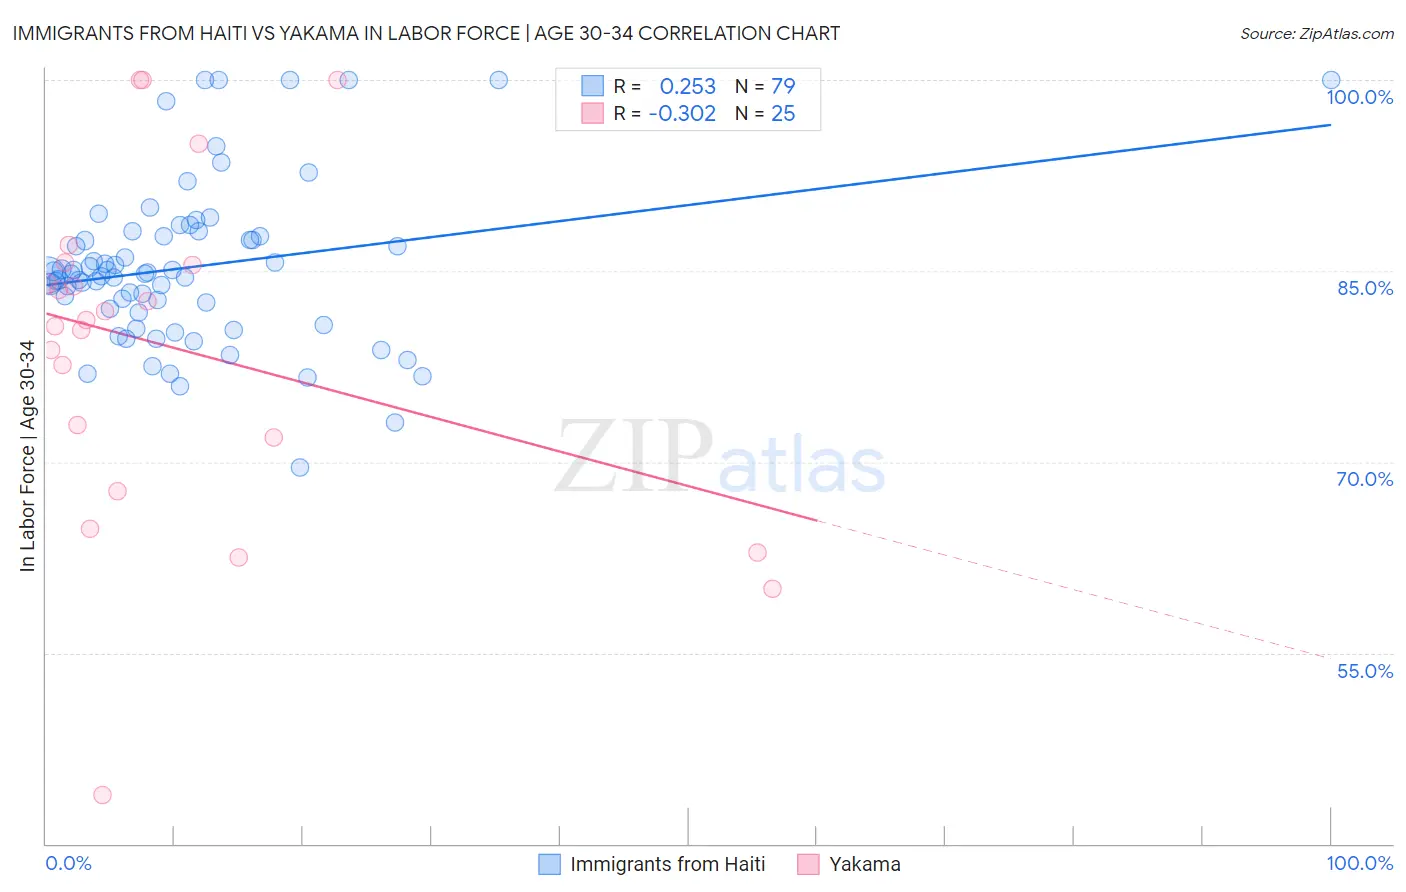
Immigrants from Haiti vs Yakama In Labor Force | Age 30-34 Correlation Chart
The statistical analysis conducted on geographies consisting of 225,211,020 people shows a weak positive correlation between the proportion of Immigrants from Haiti and labor force participation rate among population between the ages 30 and 34 in the United States with a correlation coefficient (R) of 0.253 and weighted average of 84.2%. Similarly, the statistical analysis conducted on geographies consisting of 19,914,552 people shows a mild negative correlation between the proportion of Yakama and labor force participation rate among population between the ages 30 and 34 in the United States with a correlation coefficient (R) of -0.302 and weighted average of 79.1%, a difference of 6.4%.
In Labor Force | Age 30-34 Correlation Summary
| Measurement | Immigrants from Haiti | Yakama |
| Minimum | 69.6% | 43.8% |
| Maximum | 100.0% | 100.0% |
| Range | 30.4% | 56.2% |
| Mean | 85.3% | 79.0% |
| Median | 84.8% | 81.1% |
| Interquartile 25% (IQ1) | 81.8% | 69.8% |
| Interquartile 75% (IQ3) | 87.8% | 85.6% |
| Interquartile Range (IQR) | 6.0% | 15.8% |
| Standard Deviation (Sample) | 6.3% | 13.5% |
| Standard Deviation (Population) | 6.3% | 13.2% |
Similar Demographics by In Labor Force | Age 30-34
Demographics Similar to Immigrants from Haiti by In Labor Force | Age 30-34
In terms of in labor force | age 30-34, the demographic groups most similar to Immigrants from Haiti are Scottish (84.2%, a difference of 0.010%), Immigrants from El Salvador (84.2%, a difference of 0.010%), Immigrants from Cuba (84.2%, a difference of 0.010%), Welsh (84.2%, a difference of 0.010%), and Immigrants from Bahamas (84.1%, a difference of 0.020%).
| Demographics | Rating | Rank | In Labor Force | Age 30-34 |
| Salvadorans | 3.8 /100 | #221 | Tragic 84.2% |
| Panamanians | 3.8 /100 | #222 | Tragic 84.2% |
| Immigrants | Laos | 3.6 /100 | #223 | Tragic 84.2% |
| Cubans | 3.4 /100 | #224 | Tragic 84.2% |
| Scottish | 3.1 /100 | #225 | Tragic 84.2% |
| Immigrants | El Salvador | 3.0 /100 | #226 | Tragic 84.2% |
| Immigrants | Cuba | 3.0 /100 | #227 | Tragic 84.2% |
| Immigrants | Haiti | 2.8 /100 | #228 | Tragic 84.2% |
| Welsh | 2.7 /100 | #229 | Tragic 84.2% |
| Immigrants | Bahamas | 2.6 /100 | #230 | Tragic 84.1% |
| Malaysians | 2.2 /100 | #231 | Tragic 84.1% |
| Immigrants | Immigrants | 2.0 /100 | #232 | Tragic 84.1% |
| West Indians | 1.9 /100 | #233 | Tragic 84.1% |
| Haitians | 1.8 /100 | #234 | Tragic 84.1% |
| French American Indians | 1.7 /100 | #235 | Tragic 84.1% |
Demographics Similar to Yakama by In Labor Force | Age 30-34
In terms of in labor force | age 30-34, the demographic groups most similar to Yakama are Native/Alaskan (79.2%, a difference of 0.040%), Marshallese (79.2%, a difference of 0.12%), Pima (79.0%, a difference of 0.12%), Hopi (79.3%, a difference of 0.15%), and Apache (79.0%, a difference of 0.15%).
| Demographics | Rating | Rank | In Labor Force | Age 30-34 |
| Pueblo | 0.0 /100 | #330 | Tragic 80.0% |
| Houma | 0.0 /100 | #331 | Tragic 79.9% |
| Kiowa | 0.0 /100 | #332 | Tragic 79.8% |
| Inupiat | 0.0 /100 | #333 | Tragic 79.7% |
| Hopi | 0.0 /100 | #334 | Tragic 79.3% |
| Marshallese | 0.0 /100 | #335 | Tragic 79.2% |
| Natives/Alaskans | 0.0 /100 | #336 | Tragic 79.2% |
| Yakama | 0.0 /100 | #337 | Tragic 79.1% |
| Pima | 0.0 /100 | #338 | Tragic 79.0% |
| Apache | 0.0 /100 | #339 | Tragic 79.0% |
| Ute | 0.0 /100 | #340 | Tragic 78.9% |
| Immigrants | Yemen | 0.0 /100 | #341 | Tragic 78.2% |
| Tohono O'odham | 0.0 /100 | #342 | Tragic 77.7% |
| Lumbee | 0.0 /100 | #343 | Tragic 77.3% |
| Yuman | 0.0 /100 | #344 | Tragic 77.1% |