Black/African American vs French American Indian Unemployment Among Women with Children Under 6 years
COMPARE
Black/African American
French American Indian
Unemployment Among Women with Children Under 6 years
Unemployment Among Women with Children Under 6 years Comparison
Blacks/African Americans
French American Indians
10.3%
UNEMPLOYMENT AMONG WOMEN WITH CHILDREN UNDER 6 YEARS
0.0/ 100
METRIC RATING
329th/ 347
METRIC RANK
9.2%
UNEMPLOYMENT AMONG WOMEN WITH CHILDREN UNDER 6 YEARS
0.0/ 100
METRIC RATING
311th/ 347
METRIC RANK
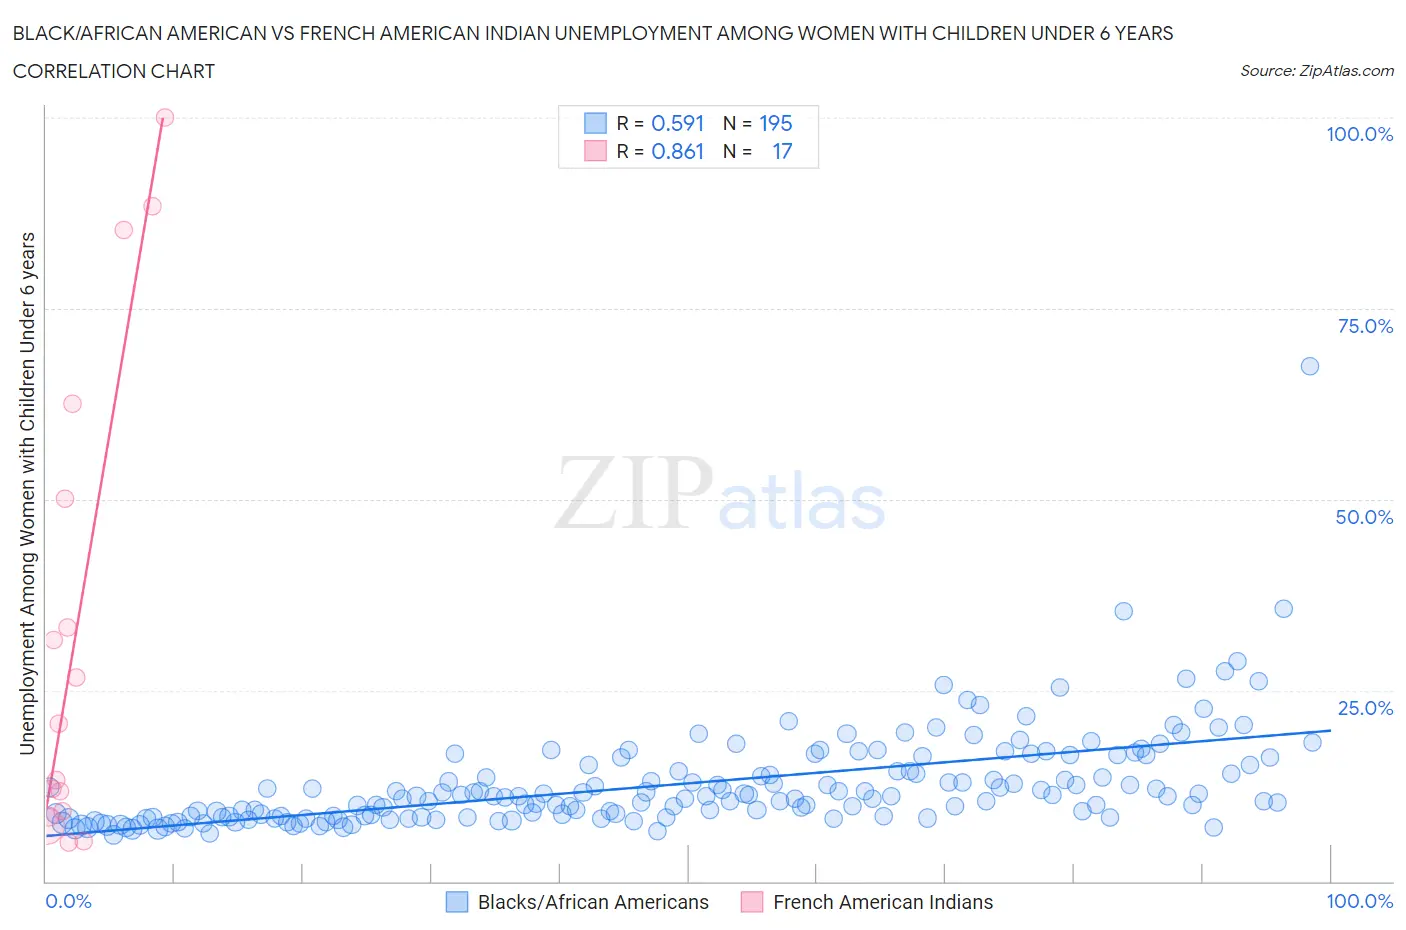
Black/African American vs French American Indian Unemployment Among Women with Children Under 6 years Correlation Chart
The statistical analysis conducted on geographies consisting of 379,285,448 people shows a substantial positive correlation between the proportion of Blacks/African Americans and unemployment rate among women with children under the age of 6 in the United States with a correlation coefficient (R) of 0.591 and weighted average of 10.3%. Similarly, the statistical analysis conducted on geographies consisting of 112,876,255 people shows a very strong positive correlation between the proportion of French American Indians and unemployment rate among women with children under the age of 6 in the United States with a correlation coefficient (R) of 0.861 and weighted average of 9.2%, a difference of 11.7%.
Unemployment Among Women with Children Under 6 years Correlation Summary
| Measurement | Black/African American | French American Indian |
| Minimum | 6.1% | 5.0% |
| Maximum | 67.4% | 100.0% |
| Range | 61.3% | 95.0% |
| Mean | 12.7% | 33.6% |
| Median | 11.1% | 20.5% |
| Interquartile 25% (IQ1) | 8.4% | 8.8% |
| Interquartile 75% (IQ3) | 14.4% | 56.3% |
| Interquartile Range (IQR) | 6.0% | 47.5% |
| Standard Deviation (Sample) | 6.6% | 31.9% |
| Standard Deviation (Population) | 6.6% | 31.0% |
Demographics Similar to Blacks/African Americans and French American Indians by Unemployment Among Women with Children Under 6 years
In terms of unemployment among women with children under 6 years, the demographic groups most similar to Blacks/African Americans are Tohono O'odham (10.2%, a difference of 0.74%), Ottawa (9.9%, a difference of 4.1%), Pennsylvania German (10.8%, a difference of 4.8%), Delaware (9.8%, a difference of 4.9%), and Choctaw (9.8%, a difference of 5.0%). Similarly, the demographic groups most similar to French American Indians are Immigrants from the Azores (9.2%, a difference of 0.14%), Cajun (9.2%, a difference of 0.28%), American (9.3%, a difference of 0.58%), Fijian (9.3%, a difference of 0.61%), and Cherokee (9.3%, a difference of 1.4%).
| Demographics | Rating | Rank | Unemployment Among Women with Children Under 6 years |
| Cajuns | 0.0 /100 | #310 | Tragic 9.2% |
| French American Indians | 0.0 /100 | #311 | Tragic 9.2% |
| Immigrants | Azores | 0.0 /100 | #312 | Tragic 9.2% |
| Americans | 0.0 /100 | #313 | Tragic 9.3% |
| Fijians | 0.0 /100 | #314 | Tragic 9.3% |
| Cherokee | 0.0 /100 | #315 | Tragic 9.3% |
| Houma | 0.0 /100 | #316 | Tragic 9.4% |
| Dutch West Indians | 0.0 /100 | #317 | Tragic 9.5% |
| Osage | 0.0 /100 | #318 | Tragic 9.5% |
| Marshallese | 0.0 /100 | #319 | Tragic 9.6% |
| Potawatomi | 0.0 /100 | #320 | Tragic 9.6% |
| Central American Indians | 0.0 /100 | #321 | Tragic 9.6% |
| Alaska Natives | 0.0 /100 | #322 | Tragic 9.6% |
| Immigrants | Bahamas | 0.0 /100 | #323 | Tragic 9.6% |
| Paiute | 0.0 /100 | #324 | Tragic 9.7% |
| Choctaw | 0.0 /100 | #325 | Tragic 9.8% |
| Delaware | 0.0 /100 | #326 | Tragic 9.8% |
| Ottawa | 0.0 /100 | #327 | Tragic 9.9% |
| Tohono O'odham | 0.0 /100 | #328 | Tragic 10.2% |
| Blacks/African Americans | 0.0 /100 | #329 | Tragic 10.3% |
| Pennsylvania Germans | 0.0 /100 | #330 | Tragic 10.8% |