Immigrants from Germany vs Immigrants from Brazil Unemployment Among Women with Children Under 6 years
COMPARE
Immigrants from Germany
Immigrants from Brazil
Unemployment Among Women with Children Under 6 years
Unemployment Among Women with Children Under 6 years Comparison
Immigrants from Germany
Immigrants from Brazil
7.9%
UNEMPLOYMENT AMONG WOMEN WITH CHILDREN UNDER 6 YEARS
8.5/ 100
METRIC RATING
221st/ 347
METRIC RANK
7.5%
UNEMPLOYMENT AMONG WOMEN WITH CHILDREN UNDER 6 YEARS
77.3/ 100
METRIC RATING
148th/ 347
METRIC RANK
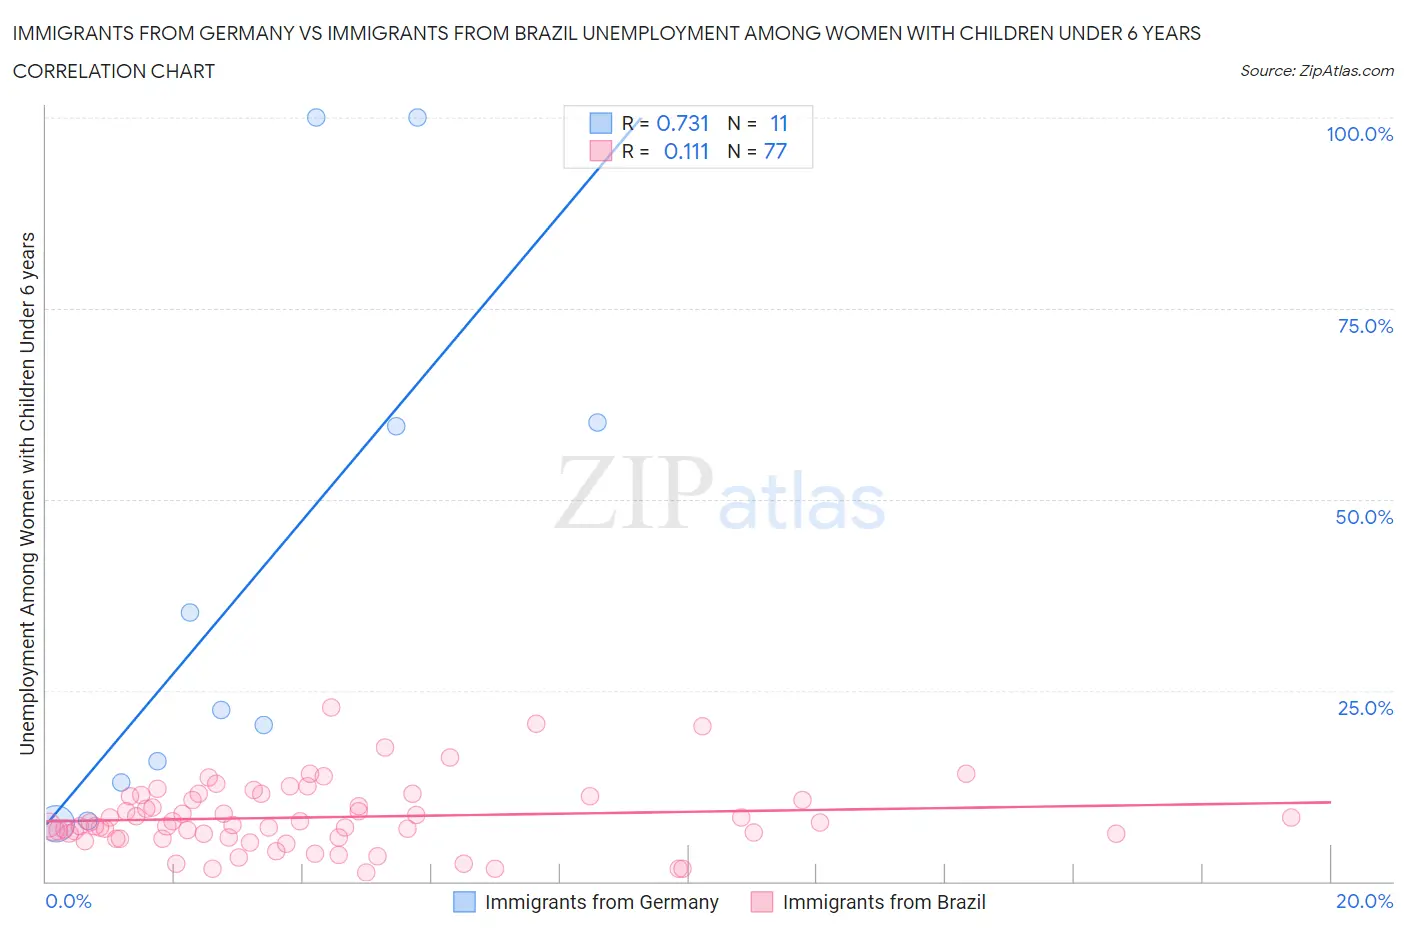
Immigrants from Germany vs Immigrants from Brazil Unemployment Among Women with Children Under 6 years Correlation Chart
The statistical analysis conducted on geographies consisting of 335,343,669 people shows a strong positive correlation between the proportion of Immigrants from Germany and unemployment rate among women with children under the age of 6 in the United States with a correlation coefficient (R) of 0.731 and weighted average of 7.9%. Similarly, the statistical analysis conducted on geographies consisting of 268,259,318 people shows a poor positive correlation between the proportion of Immigrants from Brazil and unemployment rate among women with children under the age of 6 in the United States with a correlation coefficient (R) of 0.111 and weighted average of 7.5%, a difference of 6.1%.
Unemployment Among Women with Children Under 6 years Correlation Summary
| Measurement | Immigrants from Germany | Immigrants from Brazil |
| Minimum | 7.6% | 1.2% |
| Maximum | 100.0% | 22.7% |
| Range | 92.4% | 21.5% |
| Mean | 40.2% | 8.4% |
| Median | 22.4% | 7.4% |
| Interquartile 25% (IQ1) | 12.9% | 5.7% |
| Interquartile 75% (IQ3) | 60.0% | 11.1% |
| Interquartile Range (IQR) | 47.1% | 5.3% |
| Standard Deviation (Sample) | 34.8% | 4.4% |
| Standard Deviation (Population) | 33.2% | 4.4% |
Similar Demographics by Unemployment Among Women with Children Under 6 years
Demographics Similar to Immigrants from Germany by Unemployment Among Women with Children Under 6 years
In terms of unemployment among women with children under 6 years, the demographic groups most similar to Immigrants from Germany are Samoan (7.9%, a difference of 0.020%), Carpatho Rusyn (8.0%, a difference of 0.15%), South American Indian (7.9%, a difference of 0.16%), Arab (7.9%, a difference of 0.17%), and Moroccan (7.9%, a difference of 0.25%).
| Demographics | Rating | Rank | Unemployment Among Women with Children Under 6 years |
| Spanish | 11.3 /100 | #214 | Poor 7.9% |
| Ecuadorians | 11.2 /100 | #215 | Poor 7.9% |
| Immigrants | Lebanon | 11.1 /100 | #216 | Poor 7.9% |
| Immigrants | Nigeria | 10.3 /100 | #217 | Poor 7.9% |
| Moroccans | 9.7 /100 | #218 | Tragic 7.9% |
| Arabs | 9.4 /100 | #219 | Tragic 7.9% |
| South American Indians | 9.3 /100 | #220 | Tragic 7.9% |
| Immigrants | Germany | 8.5 /100 | #221 | Tragic 7.9% |
| Samoans | 8.4 /100 | #222 | Tragic 7.9% |
| Carpatho Rusyns | 7.8 /100 | #223 | Tragic 8.0% |
| English | 7.2 /100 | #224 | Tragic 8.0% |
| Germans | 7.0 /100 | #225 | Tragic 8.0% |
| Senegalese | 6.2 /100 | #226 | Tragic 8.0% |
| Portuguese | 6.2 /100 | #227 | Tragic 8.0% |
| Immigrants | Sudan | 6.0 /100 | #228 | Tragic 8.0% |
Demographics Similar to Immigrants from Brazil by Unemployment Among Women with Children Under 6 years
In terms of unemployment among women with children under 6 years, the demographic groups most similar to Immigrants from Brazil are Immigrants from Oceania (7.5%, a difference of 0.11%), Colombian (7.5%, a difference of 0.12%), Aleut (7.5%, a difference of 0.12%), Immigrants from Jordan (7.5%, a difference of 0.16%), and Japanese (7.5%, a difference of 0.16%).
| Demographics | Rating | Rank | Unemployment Among Women with Children Under 6 years |
| Greeks | 82.6 /100 | #141 | Excellent 7.4% |
| Immigrants | Argentina | 81.5 /100 | #142 | Excellent 7.5% |
| Koreans | 81.3 /100 | #143 | Excellent 7.5% |
| Europeans | 79.1 /100 | #144 | Good 7.5% |
| Immigrants | Jordan | 78.9 /100 | #145 | Good 7.5% |
| Japanese | 78.9 /100 | #146 | Good 7.5% |
| Immigrants | Oceania | 78.4 /100 | #147 | Good 7.5% |
| Immigrants | Brazil | 77.3 /100 | #148 | Good 7.5% |
| Colombians | 76.1 /100 | #149 | Good 7.5% |
| Aleuts | 76.0 /100 | #150 | Good 7.5% |
| Immigrants | Peru | 74.9 /100 | #151 | Good 7.5% |
| Bangladeshis | 74.8 /100 | #152 | Good 7.5% |
| Uruguayans | 74.7 /100 | #153 | Good 7.5% |
| Northern Europeans | 74.3 /100 | #154 | Good 7.5% |
| South Americans | 74.1 /100 | #155 | Good 7.5% |