Immigrants from Fiji vs Puerto Rican Female Unemployment
COMPARE
Immigrants from Fiji
Puerto Rican
Female Unemployment
Female Unemployment Comparison
Immigrants from Fiji
Puerto Ricans
5.8%
FEMALE UNEMPLOYMENT
0.2/ 100
METRIC RATING
259th/ 347
METRIC RANK
8.3%
FEMALE UNEMPLOYMENT
0.0/ 100
METRIC RATING
342nd/ 347
METRIC RANK
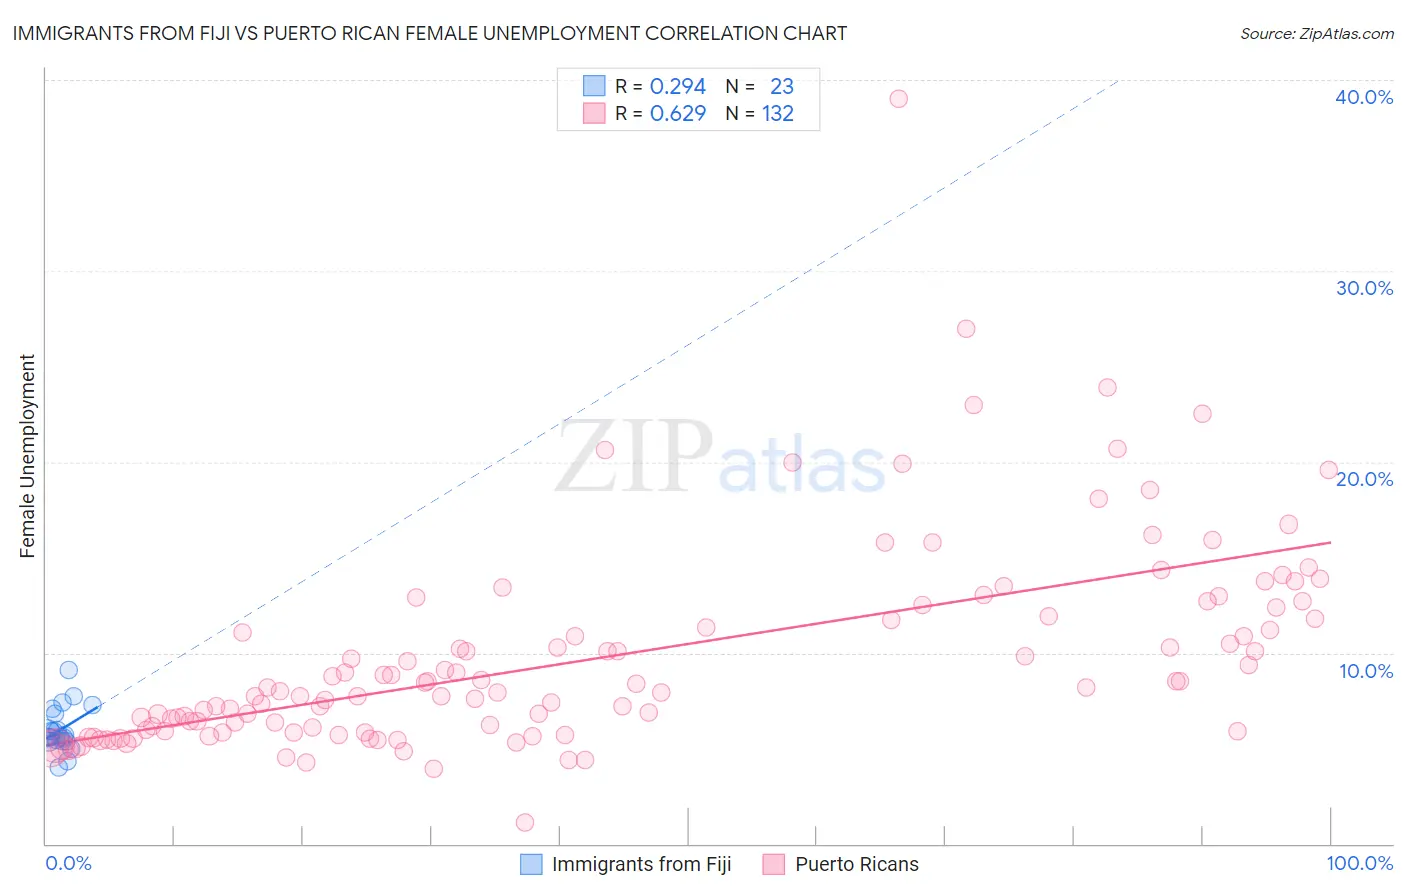
Immigrants from Fiji vs Puerto Rican Female Unemployment Correlation Chart
The statistical analysis conducted on geographies consisting of 93,721,389 people shows a weak positive correlation between the proportion of Immigrants from Fiji and unemploymnet rate among females in the United States with a correlation coefficient (R) of 0.294 and weighted average of 5.8%. Similarly, the statistical analysis conducted on geographies consisting of 522,192,067 people shows a significant positive correlation between the proportion of Puerto Ricans and unemploymnet rate among females in the United States with a correlation coefficient (R) of 0.629 and weighted average of 8.3%, a difference of 44.9%.
Female Unemployment Correlation Summary
| Measurement | Immigrants from Fiji | Puerto Rican |
| Minimum | 4.0% | 1.1% |
| Maximum | 9.1% | 39.0% |
| Range | 5.1% | 37.9% |
| Mean | 6.0% | 9.7% |
| Median | 5.6% | 8.1% |
| Interquartile 25% (IQ1) | 5.4% | 5.9% |
| Interquartile 75% (IQ3) | 6.8% | 11.8% |
| Interquartile Range (IQR) | 1.5% | 5.9% |
| Standard Deviation (Sample) | 1.1% | 5.4% |
| Standard Deviation (Population) | 1.1% | 5.4% |
Similar Demographics by Female Unemployment
Demographics Similar to Immigrants from Fiji by Female Unemployment
In terms of female unemployment, the demographic groups most similar to Immigrants from Fiji are Nigerian (5.8%, a difference of 0.040%), Immigrants from Portugal (5.8%, a difference of 0.11%), Kiowa (5.8%, a difference of 0.30%), Immigrants from Nigeria (5.8%, a difference of 0.33%), and Dutch West Indian (5.7%, a difference of 0.91%).
| Demographics | Rating | Rank | Female Unemployment |
| Cajuns | 0.7 /100 | #252 | Tragic 5.7% |
| Immigrants | Sierra Leone | 0.6 /100 | #253 | Tragic 5.7% |
| Immigrants | Immigrants | 0.6 /100 | #254 | Tragic 5.7% |
| Immigrants | Cameroon | 0.6 /100 | #255 | Tragic 5.7% |
| Sub-Saharan Africans | 0.4 /100 | #256 | Tragic 5.7% |
| Dutch West Indians | 0.3 /100 | #257 | Tragic 5.7% |
| Immigrants | Portugal | 0.2 /100 | #258 | Tragic 5.8% |
| Immigrants | Fiji | 0.2 /100 | #259 | Tragic 5.8% |
| Nigerians | 0.2 /100 | #260 | Tragic 5.8% |
| Kiowa | 0.1 /100 | #261 | Tragic 5.8% |
| Immigrants | Nigeria | 0.1 /100 | #262 | Tragic 5.8% |
| Immigrants | Azores | 0.1 /100 | #263 | Tragic 5.8% |
| Immigrants | Bahamas | 0.1 /100 | #264 | Tragic 5.8% |
| Blackfeet | 0.0 /100 | #265 | Tragic 5.9% |
| Cape Verdeans | 0.0 /100 | #266 | Tragic 5.9% |
Demographics Similar to Puerto Ricans by Female Unemployment
In terms of female unemployment, the demographic groups most similar to Puerto Ricans are Inupiat (8.2%, a difference of 2.2%), Hopi (8.1%, a difference of 3.0%), Arapaho (8.8%, a difference of 5.4%), Immigrants from Yemen (7.8%, a difference of 6.4%), and Tohono O'odham (7.7%, a difference of 7.7%).
| Demographics | Rating | Rank | Female Unemployment |
| Menominee | 0.0 /100 | #333 | Tragic 7.0% |
| Immigrants | Armenia | 0.0 /100 | #334 | Tragic 7.1% |
| Dominicans | 0.0 /100 | #335 | Tragic 7.2% |
| Immigrants | Dominican Republic | 0.0 /100 | #336 | Tragic 7.2% |
| Navajo | 0.0 /100 | #337 | Tragic 7.3% |
| Tohono O'odham | 0.0 /100 | #338 | Tragic 7.7% |
| Immigrants | Yemen | 0.0 /100 | #339 | Tragic 7.8% |
| Hopi | 0.0 /100 | #340 | Tragic 8.1% |
| Inupiat | 0.0 /100 | #341 | Tragic 8.2% |
| Puerto Ricans | 0.0 /100 | #342 | Tragic 8.3% |
| Arapaho | 0.0 /100 | #343 | Tragic 8.8% |
| Pima | 0.0 /100 | #344 | Tragic 9.3% |
| Yuman | 0.0 /100 | #345 | Tragic 9.6% |
| Yup'ik | 0.0 /100 | #346 | Tragic 10.9% |
| Crow | 0.0 /100 | #347 | Tragic 12.1% |