Immigrants from Fiji vs Barbadian Female Unemployment
COMPARE
Immigrants from Fiji
Barbadian
Female Unemployment
Female Unemployment Comparison
Immigrants from Fiji
Barbadians
5.8%
FEMALE UNEMPLOYMENT
0.2/ 100
METRIC RATING
259th/ 347
METRIC RANK
6.2%
FEMALE UNEMPLOYMENT
0.0/ 100
METRIC RATING
303rd/ 347
METRIC RANK
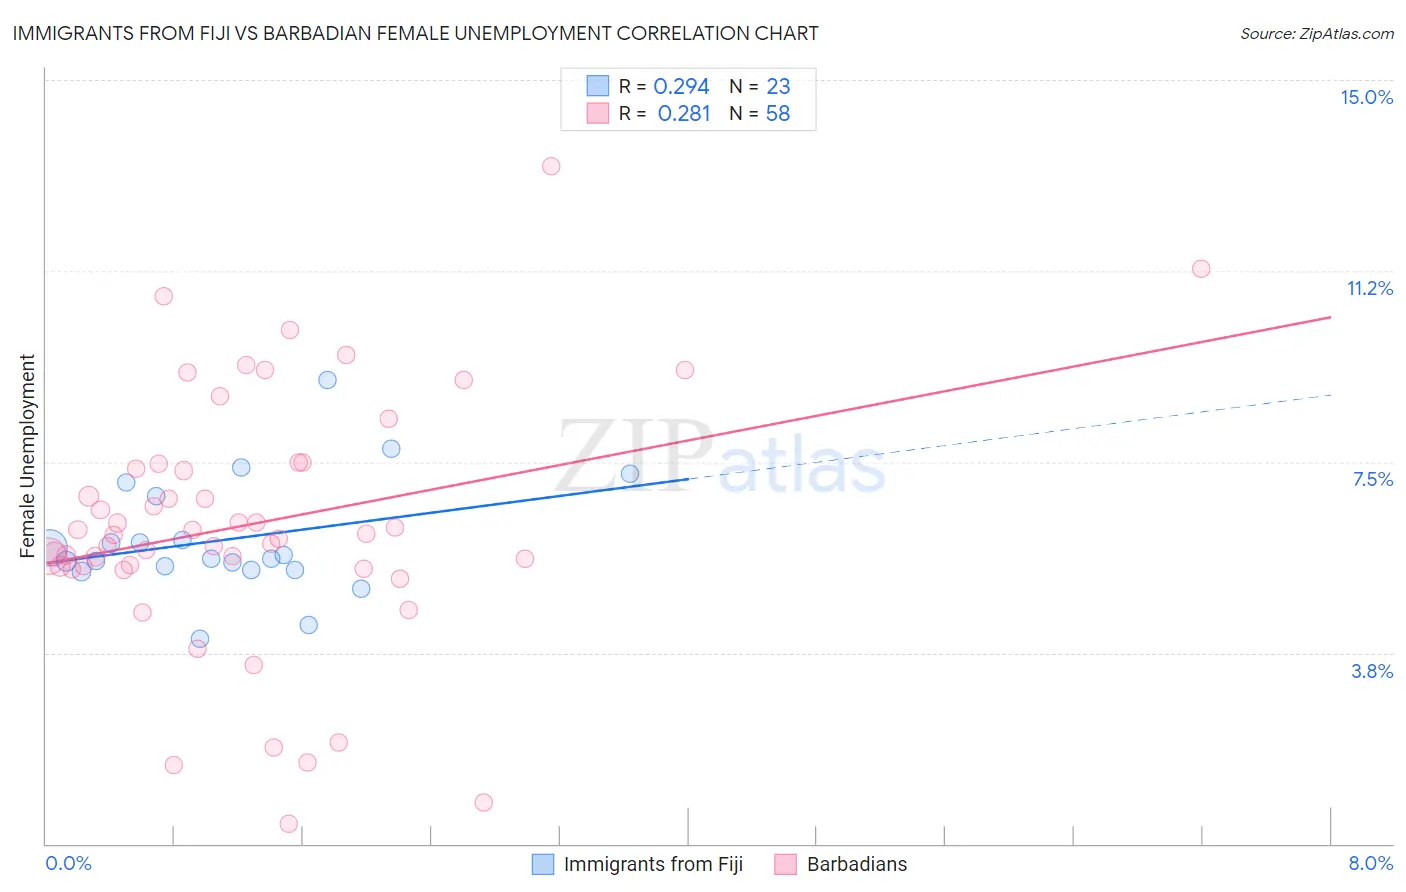
Immigrants from Fiji vs Barbadian Female Unemployment Correlation Chart
The statistical analysis conducted on geographies consisting of 93,721,389 people shows a weak positive correlation between the proportion of Immigrants from Fiji and unemploymnet rate among females in the United States with a correlation coefficient (R) of 0.294 and weighted average of 5.8%. Similarly, the statistical analysis conducted on geographies consisting of 141,186,778 people shows a weak positive correlation between the proportion of Barbadians and unemploymnet rate among females in the United States with a correlation coefficient (R) of 0.281 and weighted average of 6.2%, a difference of 7.5%.
Female Unemployment Correlation Summary
| Measurement | Immigrants from Fiji | Barbadian |
| Minimum | 4.0% | 0.40% |
| Maximum | 9.1% | 13.3% |
| Range | 5.1% | 12.9% |
| Mean | 6.0% | 6.3% |
| Median | 5.6% | 6.1% |
| Interquartile 25% (IQ1) | 5.4% | 5.4% |
| Interquartile 75% (IQ3) | 6.8% | 7.5% |
| Interquartile Range (IQR) | 1.5% | 2.0% |
| Standard Deviation (Sample) | 1.1% | 2.5% |
| Standard Deviation (Population) | 1.1% | 2.5% |
Similar Demographics by Female Unemployment
Demographics Similar to Immigrants from Fiji by Female Unemployment
In terms of female unemployment, the demographic groups most similar to Immigrants from Fiji are Nigerian (5.8%, a difference of 0.040%), Immigrants from Portugal (5.8%, a difference of 0.11%), Kiowa (5.8%, a difference of 0.30%), Immigrants from Nigeria (5.8%, a difference of 0.33%), and Dutch West Indian (5.7%, a difference of 0.91%).
| Demographics | Rating | Rank | Female Unemployment |
| Cajuns | 0.7 /100 | #252 | Tragic 5.7% |
| Immigrants | Sierra Leone | 0.6 /100 | #253 | Tragic 5.7% |
| Immigrants | Immigrants | 0.6 /100 | #254 | Tragic 5.7% |
| Immigrants | Cameroon | 0.6 /100 | #255 | Tragic 5.7% |
| Sub-Saharan Africans | 0.4 /100 | #256 | Tragic 5.7% |
| Dutch West Indians | 0.3 /100 | #257 | Tragic 5.7% |
| Immigrants | Portugal | 0.2 /100 | #258 | Tragic 5.8% |
| Immigrants | Fiji | 0.2 /100 | #259 | Tragic 5.8% |
| Nigerians | 0.2 /100 | #260 | Tragic 5.8% |
| Kiowa | 0.1 /100 | #261 | Tragic 5.8% |
| Immigrants | Nigeria | 0.1 /100 | #262 | Tragic 5.8% |
| Immigrants | Azores | 0.1 /100 | #263 | Tragic 5.8% |
| Immigrants | Bahamas | 0.1 /100 | #264 | Tragic 5.8% |
| Blackfeet | 0.0 /100 | #265 | Tragic 5.9% |
| Cape Verdeans | 0.0 /100 | #266 | Tragic 5.9% |
Demographics Similar to Barbadians by Female Unemployment
In terms of female unemployment, the demographic groups most similar to Barbadians are U.S. Virgin Islander (6.2%, a difference of 0.34%), Immigrants from Jamaica (6.2%, a difference of 0.37%), Spanish American Indian (6.2%, a difference of 0.42%), Immigrants from Barbados (6.2%, a difference of 0.50%), and Immigrants from Central America (6.2%, a difference of 0.58%).
| Demographics | Rating | Rank | Female Unemployment |
| Alaskan Athabascans | 0.0 /100 | #296 | Tragic 6.1% |
| West Indians | 0.0 /100 | #297 | Tragic 6.1% |
| Jamaicans | 0.0 /100 | #298 | Tragic 6.1% |
| Ute | 0.0 /100 | #299 | Tragic 6.1% |
| Immigrants | Haiti | 0.0 /100 | #300 | Tragic 6.1% |
| Immigrants | Barbados | 0.0 /100 | #301 | Tragic 6.2% |
| U.S. Virgin Islanders | 0.0 /100 | #302 | Tragic 6.2% |
| Barbadians | 0.0 /100 | #303 | Tragic 6.2% |
| Immigrants | Jamaica | 0.0 /100 | #304 | Tragic 6.2% |
| Spanish American Indians | 0.0 /100 | #305 | Tragic 6.2% |
| Immigrants | Central America | 0.0 /100 | #306 | Tragic 6.2% |
| Shoshone | 0.0 /100 | #307 | Tragic 6.2% |
| Hispanics or Latinos | 0.0 /100 | #308 | Tragic 6.2% |
| Ecuadorians | 0.0 /100 | #309 | Tragic 6.3% |
| Central American Indians | 0.0 /100 | #310 | Tragic 6.3% |