Immigrants from Fiji vs Immigrants from Nepal Female Unemployment
COMPARE
Immigrants from Fiji
Immigrants from Nepal
Female Unemployment
Female Unemployment Comparison
Immigrants from Fiji
Immigrants from Nepal
5.8%
FEMALE UNEMPLOYMENT
0.2/ 100
METRIC RATING
259th/ 347
METRIC RANK
4.9%
FEMALE UNEMPLOYMENT
98.6/ 100
METRIC RATING
62nd/ 347
METRIC RANK
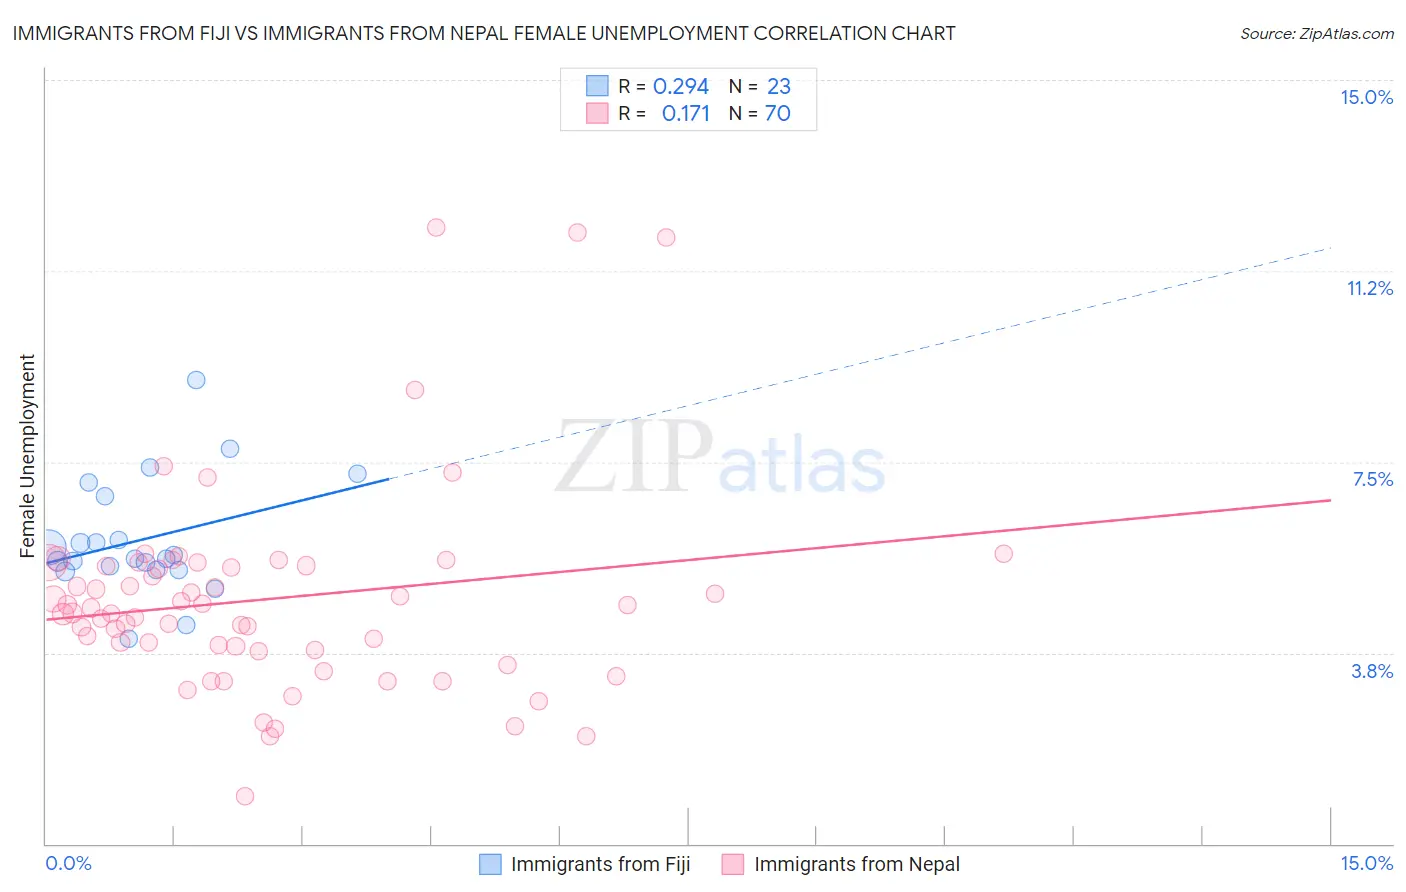
Immigrants from Fiji vs Immigrants from Nepal Female Unemployment Correlation Chart
The statistical analysis conducted on geographies consisting of 93,721,389 people shows a weak positive correlation between the proportion of Immigrants from Fiji and unemploymnet rate among females in the United States with a correlation coefficient (R) of 0.294 and weighted average of 5.8%. Similarly, the statistical analysis conducted on geographies consisting of 186,597,918 people shows a poor positive correlation between the proportion of Immigrants from Nepal and unemploymnet rate among females in the United States with a correlation coefficient (R) of 0.171 and weighted average of 4.9%, a difference of 17.0%.
Female Unemployment Correlation Summary
| Measurement | Immigrants from Fiji | Immigrants from Nepal |
| Minimum | 4.0% | 0.93% |
| Maximum | 9.1% | 12.1% |
| Range | 5.1% | 11.2% |
| Mean | 6.0% | 4.8% |
| Median | 5.6% | 4.6% |
| Interquartile 25% (IQ1) | 5.4% | 3.8% |
| Interquartile 75% (IQ3) | 6.8% | 5.5% |
| Interquartile Range (IQR) | 1.5% | 1.7% |
| Standard Deviation (Sample) | 1.1% | 2.0% |
| Standard Deviation (Population) | 1.1% | 2.0% |
Similar Demographics by Female Unemployment
Demographics Similar to Immigrants from Fiji by Female Unemployment
In terms of female unemployment, the demographic groups most similar to Immigrants from Fiji are Nigerian (5.8%, a difference of 0.040%), Immigrants from Portugal (5.8%, a difference of 0.11%), Kiowa (5.8%, a difference of 0.30%), Immigrants from Nigeria (5.8%, a difference of 0.33%), and Dutch West Indian (5.7%, a difference of 0.91%).
| Demographics | Rating | Rank | Female Unemployment |
| Cajuns | 0.7 /100 | #252 | Tragic 5.7% |
| Immigrants | Sierra Leone | 0.6 /100 | #253 | Tragic 5.7% |
| Immigrants | Immigrants | 0.6 /100 | #254 | Tragic 5.7% |
| Immigrants | Cameroon | 0.6 /100 | #255 | Tragic 5.7% |
| Sub-Saharan Africans | 0.4 /100 | #256 | Tragic 5.7% |
| Dutch West Indians | 0.3 /100 | #257 | Tragic 5.7% |
| Immigrants | Portugal | 0.2 /100 | #258 | Tragic 5.8% |
| Immigrants | Fiji | 0.2 /100 | #259 | Tragic 5.8% |
| Nigerians | 0.2 /100 | #260 | Tragic 5.8% |
| Kiowa | 0.1 /100 | #261 | Tragic 5.8% |
| Immigrants | Nigeria | 0.1 /100 | #262 | Tragic 5.8% |
| Immigrants | Azores | 0.1 /100 | #263 | Tragic 5.8% |
| Immigrants | Bahamas | 0.1 /100 | #264 | Tragic 5.8% |
| Blackfeet | 0.0 /100 | #265 | Tragic 5.9% |
| Cape Verdeans | 0.0 /100 | #266 | Tragic 5.9% |
Demographics Similar to Immigrants from Nepal by Female Unemployment
In terms of female unemployment, the demographic groups most similar to Immigrants from Nepal are Immigrants from Canada (4.9%, a difference of 0.0%), Immigrants from Scotland (4.9%, a difference of 0.010%), Bhutanese (4.9%, a difference of 0.090%), Immigrants from Belgium (4.9%, a difference of 0.11%), and Celtic (4.9%, a difference of 0.12%).
| Demographics | Rating | Rank | Female Unemployment |
| Immigrants | Moldova | 99.0 /100 | #55 | Exceptional 4.9% |
| Serbians | 99.0 /100 | #56 | Exceptional 4.9% |
| Icelanders | 98.8 /100 | #57 | Exceptional 4.9% |
| Immigrants | Lithuania | 98.8 /100 | #58 | Exceptional 4.9% |
| Bhutanese | 98.7 /100 | #59 | Exceptional 4.9% |
| Immigrants | Scotland | 98.6 /100 | #60 | Exceptional 4.9% |
| Immigrants | Canada | 98.6 /100 | #61 | Exceptional 4.9% |
| Immigrants | Nepal | 98.6 /100 | #62 | Exceptional 4.9% |
| Immigrants | Belgium | 98.5 /100 | #63 | Exceptional 4.9% |
| Celtics | 98.5 /100 | #64 | Exceptional 4.9% |
| Immigrants | North America | 98.3 /100 | #65 | Exceptional 4.9% |
| Hungarians | 98.3 /100 | #66 | Exceptional 4.9% |
| Cubans | 98.3 /100 | #67 | Exceptional 4.9% |
| Tlingit-Haida | 98.3 /100 | #68 | Exceptional 4.9% |
| Immigrants | Ireland | 98.2 /100 | #69 | Exceptional 4.9% |