Immigrants from Ethiopia vs Navajo 6th Grade
COMPARE
Immigrants from Ethiopia
Navajo
6th Grade
6th Grade Comparison
Immigrants from Ethiopia
Navajo
96.5%
6TH GRADE
0.6/ 100
METRIC RATING
254th/ 347
METRIC RANK
96.8%
6TH GRADE
7.3/ 100
METRIC RATING
218th/ 347
METRIC RANK
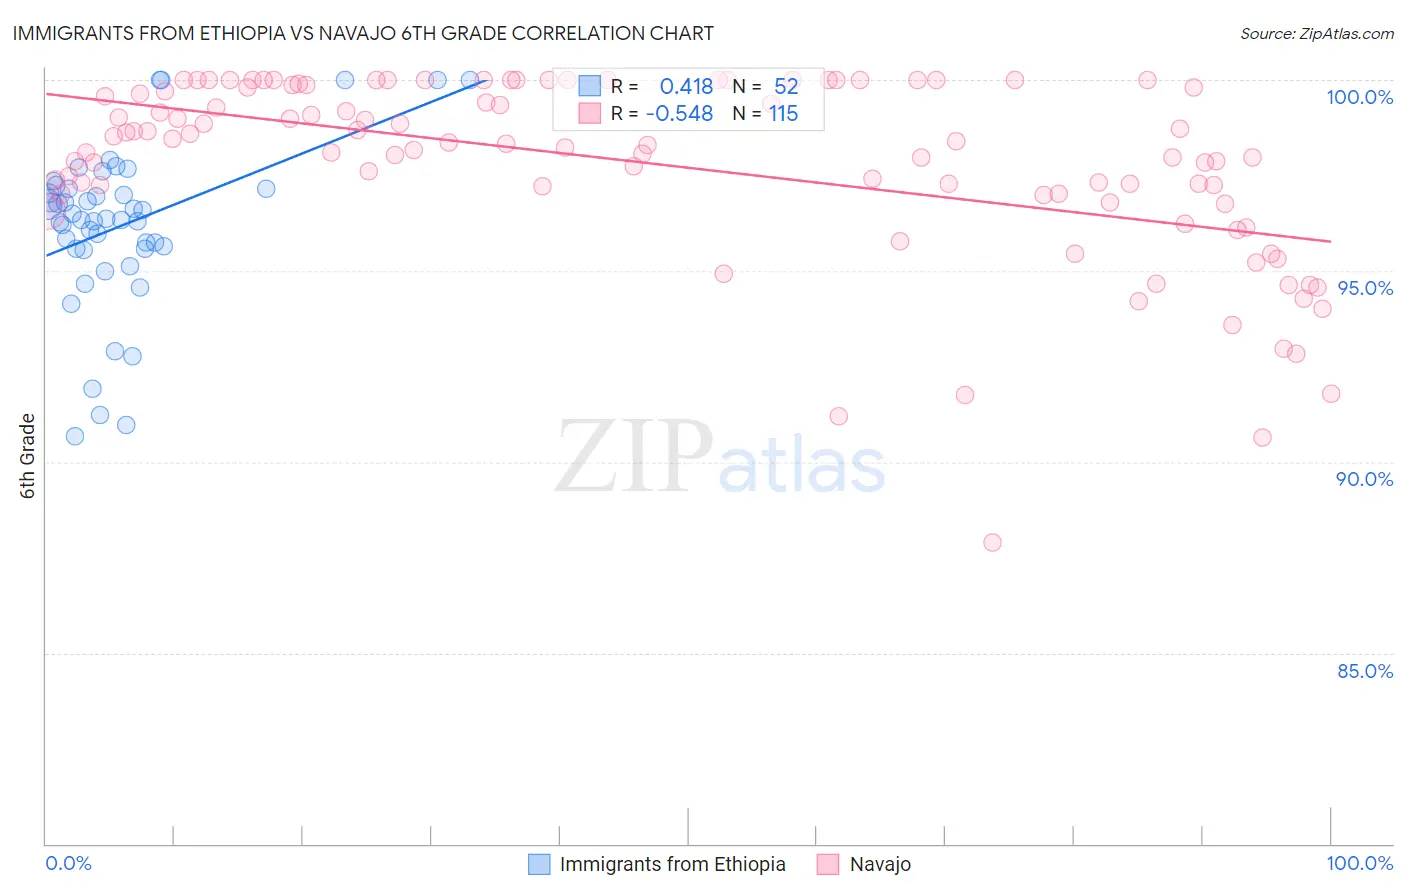
Immigrants from Ethiopia vs Navajo 6th Grade Correlation Chart
The statistical analysis conducted on geographies consisting of 211,514,076 people shows a moderate positive correlation between the proportion of Immigrants from Ethiopia and percentage of population with at least 6th grade education in the United States with a correlation coefficient (R) of 0.418 and weighted average of 96.5%. Similarly, the statistical analysis conducted on geographies consisting of 224,872,927 people shows a substantial negative correlation between the proportion of Navajo and percentage of population with at least 6th grade education in the United States with a correlation coefficient (R) of -0.548 and weighted average of 96.8%, a difference of 0.30%.
6th Grade Correlation Summary
| Measurement | Immigrants from Ethiopia | Navajo |
| Minimum | 90.7% | 87.9% |
| Maximum | 100.0% | 100.0% |
| Range | 9.3% | 12.1% |
| Mean | 96.2% | 97.8% |
| Median | 96.4% | 98.3% |
| Interquartile 25% (IQ1) | 95.6% | 97.0% |
| Interquartile 75% (IQ3) | 97.2% | 99.9% |
| Interquartile Range (IQR) | 1.6% | 2.9% |
| Standard Deviation (Sample) | 2.1% | 2.4% |
| Standard Deviation (Population) | 2.1% | 2.4% |
Similar Demographics by 6th Grade
Demographics Similar to Immigrants from Ethiopia by 6th Grade
In terms of 6th grade, the demographic groups most similar to Immigrants from Ethiopia are Jamaican (96.5%, a difference of 0.0%), Immigrants from Congo (96.5%, a difference of 0.0%), Immigrants from Uruguay (96.5%, a difference of 0.010%), U.S. Virgin Islander (96.5%, a difference of 0.010%), and Immigrants from Senegal (96.5%, a difference of 0.020%).
| Demographics | Rating | Rank | 6th Grade |
| Bolivians | 1.0 /100 | #247 | Tragic 96.5% |
| Tohono O'odham | 1.0 /100 | #248 | Tragic 96.5% |
| Colombians | 0.9 /100 | #249 | Tragic 96.5% |
| Immigrants | Middle Africa | 0.8 /100 | #250 | Tragic 96.5% |
| Immigrants | Senegal | 0.7 /100 | #251 | Tragic 96.5% |
| Immigrants | Uruguay | 0.6 /100 | #252 | Tragic 96.5% |
| Jamaicans | 0.6 /100 | #253 | Tragic 96.5% |
| Immigrants | Ethiopia | 0.6 /100 | #254 | Tragic 96.5% |
| Immigrants | Congo | 0.6 /100 | #255 | Tragic 96.5% |
| U.S. Virgin Islanders | 0.5 /100 | #256 | Tragic 96.5% |
| Taiwanese | 0.5 /100 | #257 | Tragic 96.5% |
| Immigrants | China | 0.4 /100 | #258 | Tragic 96.4% |
| South Americans | 0.4 /100 | #259 | Tragic 96.4% |
| Peruvians | 0.4 /100 | #260 | Tragic 96.4% |
| Immigrants | Sierra Leone | 0.4 /100 | #261 | Tragic 96.4% |
Demographics Similar to Navajo by 6th Grade
In terms of 6th grade, the demographic groups most similar to Navajo are Liberian (96.8%, a difference of 0.0%), Sierra Leonean (96.8%, a difference of 0.010%), Paiute (96.8%, a difference of 0.010%), Costa Rican (96.8%, a difference of 0.010%), and Immigrants from Sudan (96.8%, a difference of 0.020%).
| Demographics | Rating | Rank | 6th Grade |
| Immigrants | Iraq | 9.2 /100 | #211 | Tragic 96.8% |
| Moroccans | 9.0 /100 | #212 | Tragic 96.8% |
| Immigrants | Sudan | 8.7 /100 | #213 | Tragic 96.8% |
| Portuguese | 8.2 /100 | #214 | Tragic 96.8% |
| Sierra Leoneans | 8.0 /100 | #215 | Tragic 96.8% |
| Paiute | 7.8 /100 | #216 | Tragic 96.8% |
| Liberians | 7.5 /100 | #217 | Tragic 96.8% |
| Navajo | 7.3 /100 | #218 | Tragic 96.8% |
| Costa Ricans | 6.8 /100 | #219 | Tragic 96.8% |
| Immigrants | Morocco | 6.2 /100 | #220 | Tragic 96.7% |
| Tongans | 6.1 /100 | #221 | Tragic 96.7% |
| Immigrants | Syria | 5.9 /100 | #222 | Tragic 96.7% |
| Bahamians | 4.8 /100 | #223 | Tragic 96.7% |
| Immigrants | Southern Europe | 4.4 /100 | #224 | Tragic 96.7% |
| Immigrants | Pakistan | 4.4 /100 | #225 | Tragic 96.7% |