Immigrants from Ethiopia vs Immigrants from Honduras Male Unemployment
COMPARE
Immigrants from Ethiopia
Immigrants from Honduras
Male Unemployment
Male Unemployment Comparison
Immigrants from Ethiopia
Immigrants from Honduras
5.1%
MALE UNEMPLOYMENT
91.5/ 100
METRIC RATING
106th/ 347
METRIC RANK
5.6%
MALE UNEMPLOYMENT
1.5/ 100
METRIC RATING
235th/ 347
METRIC RANK
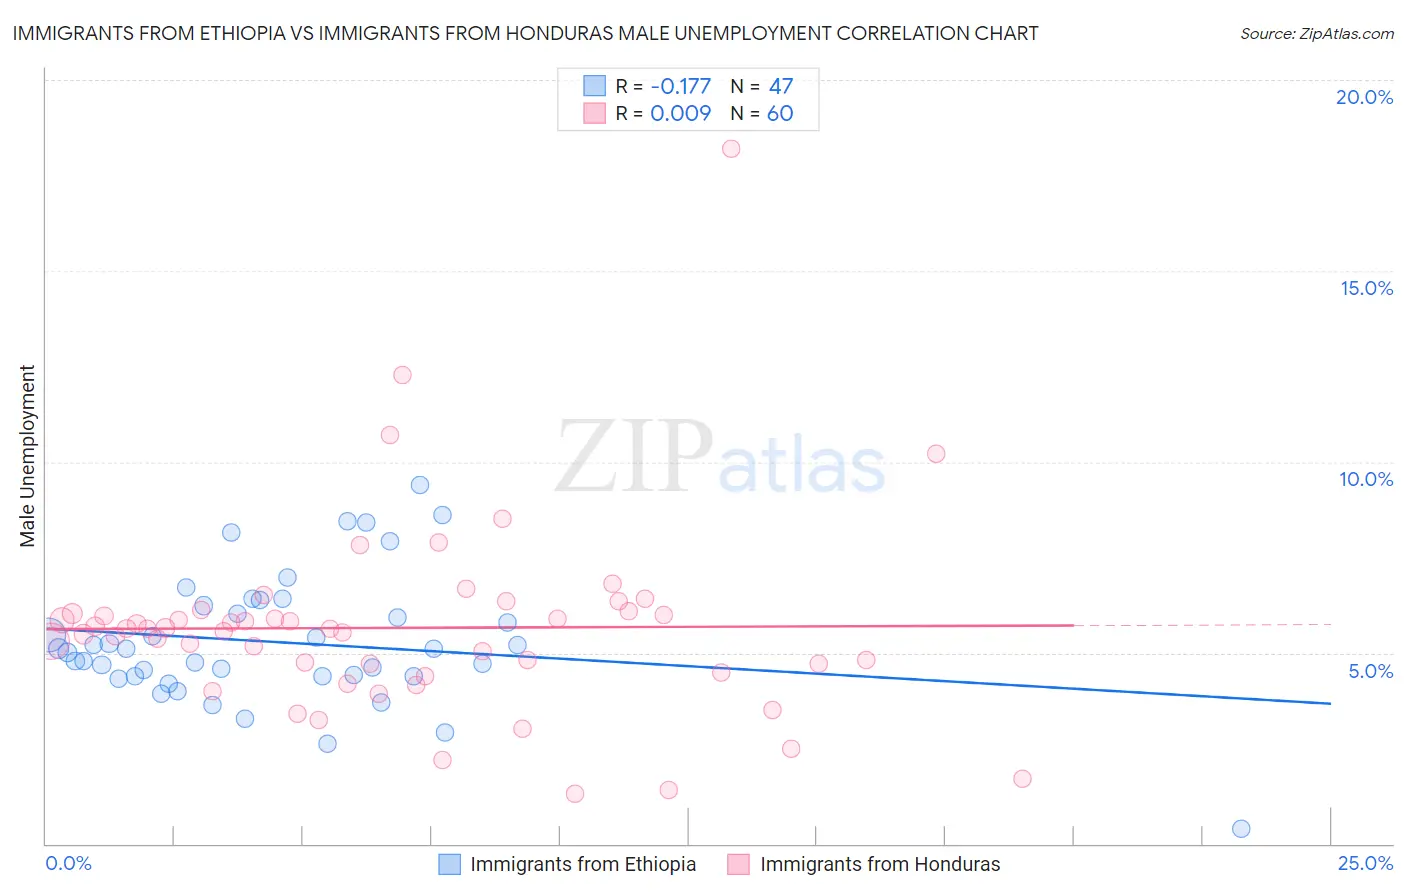
Immigrants from Ethiopia vs Immigrants from Honduras Male Unemployment Correlation Chart
The statistical analysis conducted on geographies consisting of 211,215,885 people shows a poor negative correlation between the proportion of Immigrants from Ethiopia and unemployment rate among males in the United States with a correlation coefficient (R) of -0.177 and weighted average of 5.1%. Similarly, the statistical analysis conducted on geographies consisting of 321,727,023 people shows no correlation between the proportion of Immigrants from Honduras and unemployment rate among males in the United States with a correlation coefficient (R) of 0.009 and weighted average of 5.6%, a difference of 9.9%.
Male Unemployment Correlation Summary
| Measurement | Immigrants from Ethiopia | Immigrants from Honduras |
| Minimum | 0.40% | 1.3% |
| Maximum | 9.4% | 18.2% |
| Range | 9.0% | 16.9% |
| Mean | 5.3% | 5.7% |
| Median | 5.1% | 5.6% |
| Interquartile 25% (IQ1) | 4.4% | 4.6% |
| Interquartile 75% (IQ3) | 6.2% | 6.1% |
| Interquartile Range (IQR) | 1.8% | 1.5% |
| Standard Deviation (Sample) | 1.7% | 2.6% |
| Standard Deviation (Population) | 1.7% | 2.5% |
Similar Demographics by Male Unemployment
Demographics Similar to Immigrants from Ethiopia by Male Unemployment
In terms of male unemployment, the demographic groups most similar to Immigrants from Ethiopia are Immigrants from Czechoslovakia (5.1%, a difference of 0.040%), Ethiopian (5.1%, a difference of 0.040%), Immigrants from Chile (5.1%, a difference of 0.050%), Immigrants from Nicaragua (5.1%, a difference of 0.050%), and Immigrants from Jordan (5.1%, a difference of 0.080%).
| Demographics | Rating | Rank | Male Unemployment |
| Uruguayans | 93.0 /100 | #99 | Exceptional 5.1% |
| Russians | 92.9 /100 | #100 | Exceptional 5.1% |
| German Russians | 92.7 /100 | #101 | Exceptional 5.1% |
| Immigrants | France | 92.7 /100 | #102 | Exceptional 5.1% |
| Immigrants | Jordan | 91.9 /100 | #103 | Exceptional 5.1% |
| Immigrants | Chile | 91.8 /100 | #104 | Exceptional 5.1% |
| Immigrants | Czechoslovakia | 91.7 /100 | #105 | Exceptional 5.1% |
| Immigrants | Ethiopia | 91.5 /100 | #106 | Exceptional 5.1% |
| Ethiopians | 91.3 /100 | #107 | Exceptional 5.1% |
| Immigrants | Nicaragua | 91.2 /100 | #108 | Exceptional 5.1% |
| Immigrants | Pakistan | 90.9 /100 | #109 | Exceptional 5.1% |
| Immigrants | England | 90.8 /100 | #110 | Exceptional 5.1% |
| Immigrants | Eastern Asia | 90.8 /100 | #111 | Exceptional 5.1% |
| Immigrants | Moldova | 90.3 /100 | #112 | Exceptional 5.1% |
| Immigrants | Austria | 90.3 /100 | #113 | Exceptional 5.1% |
Demographics Similar to Immigrants from Honduras by Male Unemployment
In terms of male unemployment, the demographic groups most similar to Immigrants from Honduras are Somali (5.6%, a difference of 0.030%), Immigrants from Somalia (5.6%, a difference of 0.030%), Moroccan (5.6%, a difference of 0.11%), Choctaw (5.6%, a difference of 0.14%), and Immigrants from Africa (5.6%, a difference of 0.19%).
| Demographics | Rating | Rank | Male Unemployment |
| Seminole | 1.8 /100 | #228 | Tragic 5.6% |
| Central Americans | 1.8 /100 | #229 | Tragic 5.6% |
| Immigrants | Africa | 1.7 /100 | #230 | Tragic 5.6% |
| Choctaw | 1.6 /100 | #231 | Tragic 5.6% |
| Moroccans | 1.6 /100 | #232 | Tragic 5.6% |
| Somalis | 1.5 /100 | #233 | Tragic 5.6% |
| Immigrants | Somalia | 1.5 /100 | #234 | Tragic 5.6% |
| Immigrants | Honduras | 1.5 /100 | #235 | Tragic 5.6% |
| Guatemalans | 1.2 /100 | #236 | Tragic 5.6% |
| Hondurans | 1.1 /100 | #237 | Tragic 5.6% |
| Native Hawaiians | 1.1 /100 | #238 | Tragic 5.6% |
| Immigrants | Guatemala | 1.1 /100 | #239 | Tragic 5.6% |
| Immigrants | Cameroon | 1.0 /100 | #240 | Tragic 5.6% |
| Salvadorans | 1.0 /100 | #241 | Tragic 5.7% |
| Ottawa | 0.9 /100 | #242 | Tragic 5.7% |