Immigrants from Eritrea vs American Female Unemployment
COMPARE
Immigrants from Eritrea
American
Female Unemployment
Female Unemployment Comparison
Immigrants from Eritrea
Americans
5.1%
FEMALE UNEMPLOYMENT
84.6/ 100
METRIC RATING
134th/ 347
METRIC RANK
5.1%
FEMALE UNEMPLOYMENT
90.5/ 100
METRIC RATING
116th/ 347
METRIC RANK
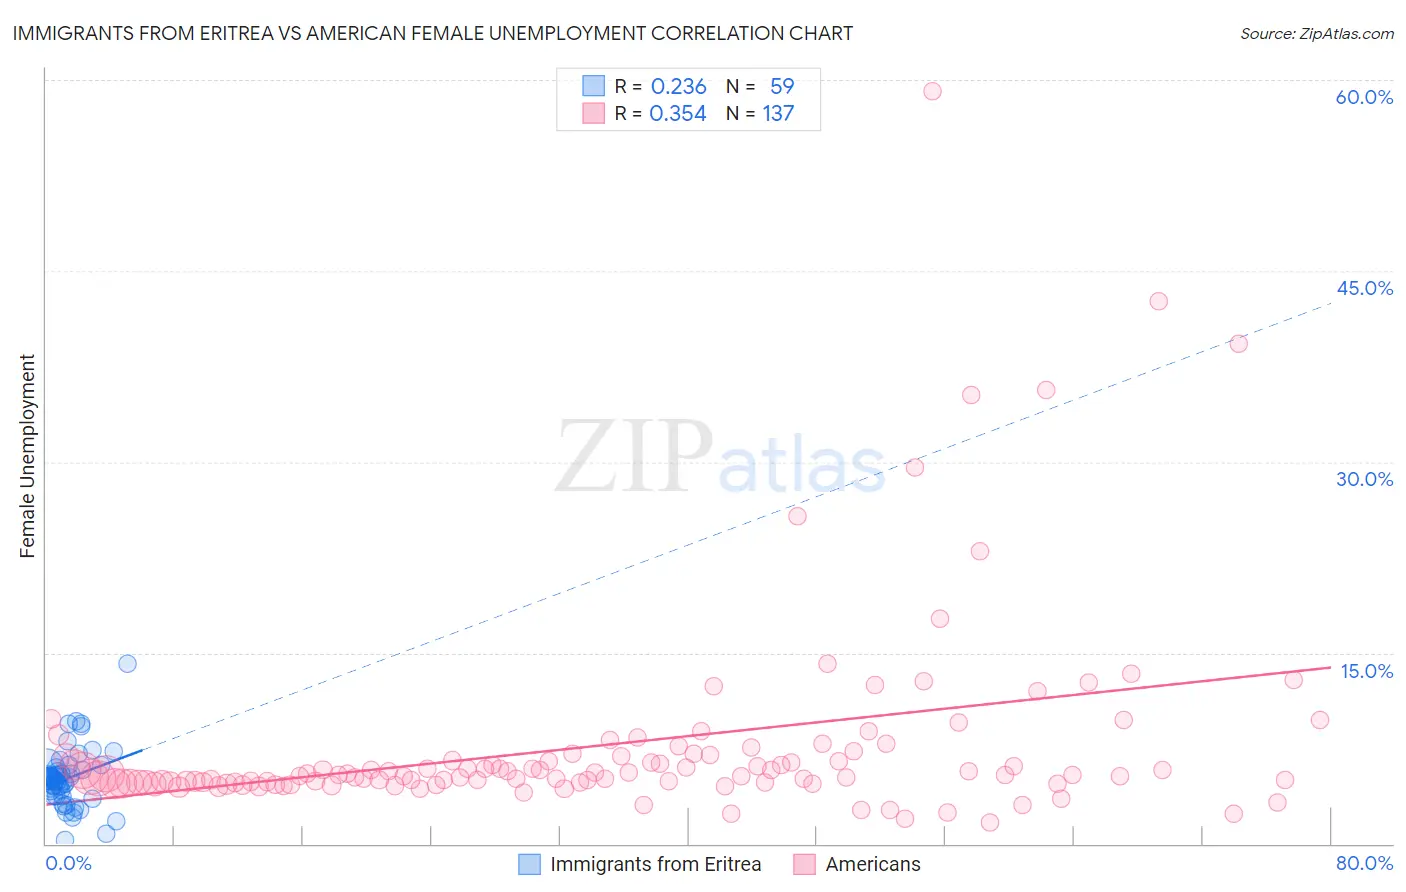
Immigrants from Eritrea vs American Female Unemployment Correlation Chart
The statistical analysis conducted on geographies consisting of 104,834,311 people shows a weak positive correlation between the proportion of Immigrants from Eritrea and unemploymnet rate among females in the United States with a correlation coefficient (R) of 0.236 and weighted average of 5.1%. Similarly, the statistical analysis conducted on geographies consisting of 565,732,279 people shows a mild positive correlation between the proportion of Americans and unemploymnet rate among females in the United States with a correlation coefficient (R) of 0.354 and weighted average of 5.1%, a difference of 0.86%.
Female Unemployment Correlation Summary
| Measurement | Immigrants from Eritrea | American |
| Minimum | 0.30% | 1.7% |
| Maximum | 14.1% | 59.1% |
| Range | 13.8% | 57.4% |
| Mean | 5.1% | 7.8% |
| Median | 5.1% | 5.4% |
| Interquartile 25% (IQ1) | 3.8% | 4.8% |
| Interquartile 75% (IQ3) | 5.8% | 6.9% |
| Interquartile Range (IQR) | 2.0% | 2.1% |
| Standard Deviation (Sample) | 2.3% | 8.0% |
| Standard Deviation (Population) | 2.2% | 7.9% |
Demographics Similar to Immigrants from Eritrea and Americans by Female Unemployment
In terms of female unemployment, the demographic groups most similar to Immigrants from Eritrea are Immigrants from Latvia (5.1%, a difference of 0.0%), Immigrants from Hong Kong (5.1%, a difference of 0.020%), Immigrants from Sri Lanka (5.1%, a difference of 0.040%), Immigrants from Ethiopia (5.1%, a difference of 0.090%), and Maltese (5.1%, a difference of 0.11%). Similarly, the demographic groups most similar to Americans are Jordanian (5.1%, a difference of 0.040%), Lebanese (5.1%, a difference of 0.080%), Immigrants from Croatia (5.1%, a difference of 0.11%), Immigrants from North Macedonia (5.1%, a difference of 0.37%), and Immigrants from Romania (5.1%, a difference of 0.39%).
| Demographics | Rating | Rank | Female Unemployment |
| Lebanese | 91.0 /100 | #115 | Exceptional 5.1% |
| Americans | 90.5 /100 | #116 | Exceptional 5.1% |
| Jordanians | 90.3 /100 | #117 | Exceptional 5.1% |
| Immigrants | Croatia | 89.9 /100 | #118 | Excellent 5.1% |
| Immigrants | North Macedonia | 88.3 /100 | #119 | Excellent 5.1% |
| Immigrants | Romania | 88.1 /100 | #120 | Excellent 5.1% |
| Immigrants | Western Europe | 88.1 /100 | #121 | Excellent 5.1% |
| Immigrants | Germany | 87.6 /100 | #122 | Excellent 5.1% |
| Immigrants | South Africa | 87.6 /100 | #123 | Excellent 5.1% |
| Immigrants | Europe | 87.2 /100 | #124 | Excellent 5.1% |
| Basques | 86.5 /100 | #125 | Excellent 5.1% |
| Immigrants | Korea | 86.3 /100 | #126 | Excellent 5.1% |
| Immigrants | Hungary | 86.0 /100 | #127 | Excellent 5.1% |
| Chileans | 85.8 /100 | #128 | Excellent 5.1% |
| Ethiopians | 85.7 /100 | #129 | Excellent 5.1% |
| Maltese | 85.5 /100 | #130 | Excellent 5.1% |
| Immigrants | Ethiopia | 85.4 /100 | #131 | Excellent 5.1% |
| Immigrants | Sri Lanka | 85.0 /100 | #132 | Excellent 5.1% |
| Immigrants | Hong Kong | 84.8 /100 | #133 | Excellent 5.1% |
| Immigrants | Eritrea | 84.6 /100 | #134 | Excellent 5.1% |
| Immigrants | Latvia | 84.6 /100 | #135 | Excellent 5.1% |