Immigrants from Eritrea vs Immigrants from Yemen Female Unemployment
COMPARE
Immigrants from Eritrea
Immigrants from Yemen
Female Unemployment
Female Unemployment Comparison
Immigrants from Eritrea
Immigrants from Yemen
5.1%
FEMALE UNEMPLOYMENT
84.6/ 100
METRIC RATING
134th/ 347
METRIC RANK
7.8%
FEMALE UNEMPLOYMENT
0.0/ 100
METRIC RATING
339th/ 347
METRIC RANK
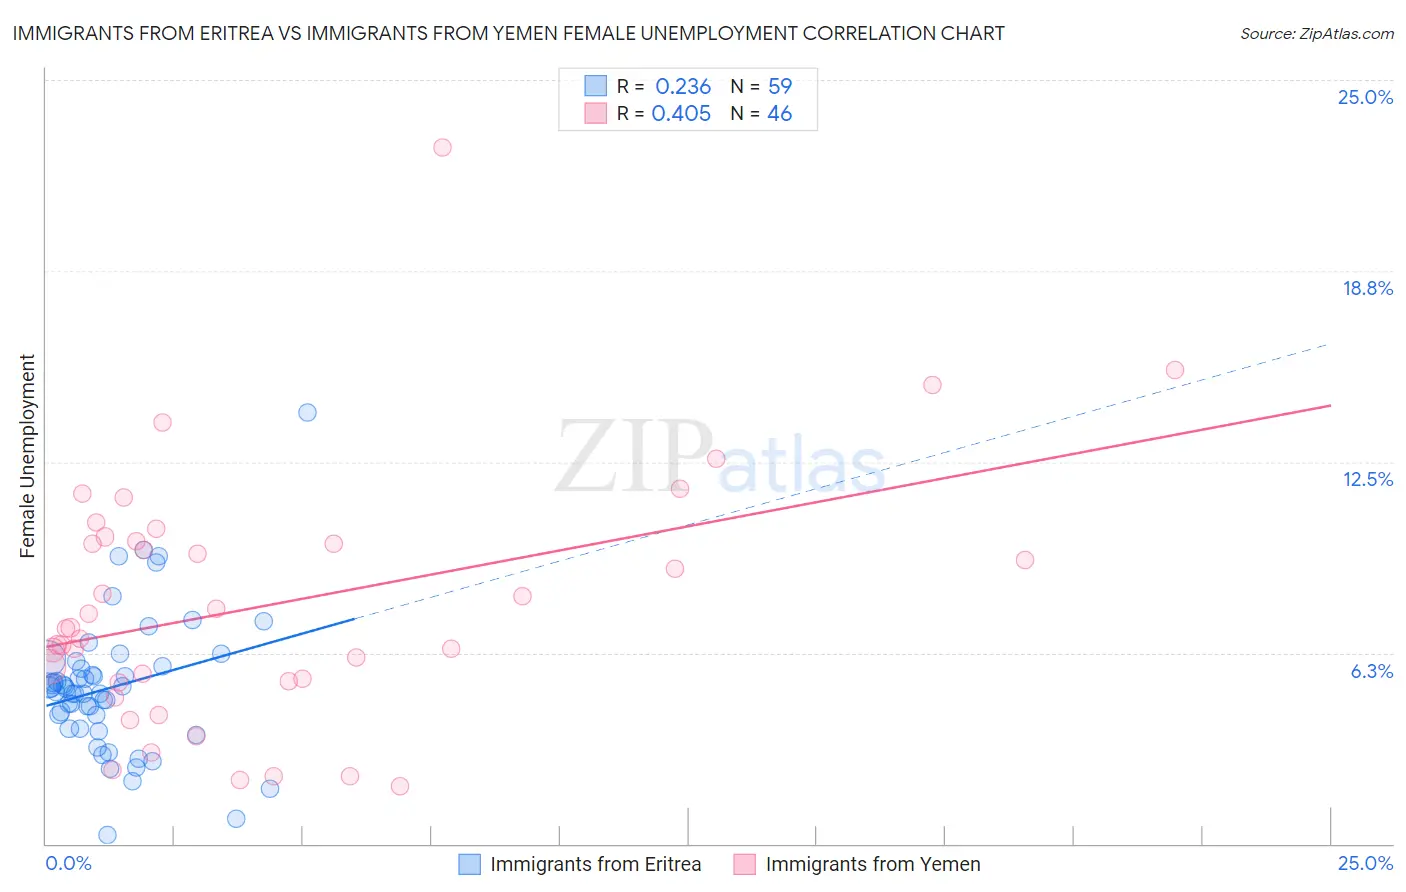
Immigrants from Eritrea vs Immigrants from Yemen Female Unemployment Correlation Chart
The statistical analysis conducted on geographies consisting of 104,834,311 people shows a weak positive correlation between the proportion of Immigrants from Eritrea and unemploymnet rate among females in the United States with a correlation coefficient (R) of 0.236 and weighted average of 5.1%. Similarly, the statistical analysis conducted on geographies consisting of 82,406,299 people shows a moderate positive correlation between the proportion of Immigrants from Yemen and unemploymnet rate among females in the United States with a correlation coefficient (R) of 0.405 and weighted average of 7.8%, a difference of 53.0%.
Female Unemployment Correlation Summary
| Measurement | Immigrants from Eritrea | Immigrants from Yemen |
| Minimum | 0.30% | 1.9% |
| Maximum | 14.1% | 22.8% |
| Range | 13.8% | 20.9% |
| Mean | 5.1% | 7.8% |
| Median | 5.1% | 7.1% |
| Interquartile 25% (IQ1) | 3.8% | 5.3% |
| Interquartile 75% (IQ3) | 5.8% | 9.9% |
| Interquartile Range (IQR) | 2.0% | 4.6% |
| Standard Deviation (Sample) | 2.3% | 4.1% |
| Standard Deviation (Population) | 2.2% | 4.1% |
Similar Demographics by Female Unemployment
Demographics Similar to Immigrants from Eritrea by Female Unemployment
In terms of female unemployment, the demographic groups most similar to Immigrants from Eritrea are Immigrants from Latvia (5.1%, a difference of 0.0%), Immigrants from Hong Kong (5.1%, a difference of 0.020%), Immigrants from Sri Lanka (5.1%, a difference of 0.040%), Indian (Asian) (5.1%, a difference of 0.050%), and Immigrants from Ethiopia (5.1%, a difference of 0.090%).
| Demographics | Rating | Rank | Female Unemployment |
| Immigrants | Hungary | 86.0 /100 | #127 | Excellent 5.1% |
| Chileans | 85.8 /100 | #128 | Excellent 5.1% |
| Ethiopians | 85.7 /100 | #129 | Excellent 5.1% |
| Maltese | 85.5 /100 | #130 | Excellent 5.1% |
| Immigrants | Ethiopia | 85.4 /100 | #131 | Excellent 5.1% |
| Immigrants | Sri Lanka | 85.0 /100 | #132 | Excellent 5.1% |
| Immigrants | Hong Kong | 84.8 /100 | #133 | Excellent 5.1% |
| Immigrants | Eritrea | 84.6 /100 | #134 | Excellent 5.1% |
| Immigrants | Latvia | 84.6 /100 | #135 | Excellent 5.1% |
| Indians (Asian) | 84.2 /100 | #136 | Excellent 5.1% |
| Pakistanis | 83.8 /100 | #137 | Excellent 5.1% |
| Chickasaw | 83.2 /100 | #138 | Excellent 5.1% |
| Immigrants | Eastern Asia | 83.0 /100 | #139 | Excellent 5.1% |
| Immigrants | France | 82.7 /100 | #140 | Excellent 5.1% |
| Immigrants | Eastern Europe | 81.5 /100 | #141 | Excellent 5.1% |
Demographics Similar to Immigrants from Yemen by Female Unemployment
In terms of female unemployment, the demographic groups most similar to Immigrants from Yemen are Tohono O'odham (7.7%, a difference of 1.2%), Hopi (8.1%, a difference of 3.3%), Inupiat (8.2%, a difference of 4.1%), Puerto Rican (8.3%, a difference of 6.4%), and Navajo (7.3%, a difference of 7.6%).
| Demographics | Rating | Rank | Female Unemployment |
| Sioux | 0.0 /100 | #332 | Tragic 7.0% |
| Menominee | 0.0 /100 | #333 | Tragic 7.0% |
| Immigrants | Armenia | 0.0 /100 | #334 | Tragic 7.1% |
| Dominicans | 0.0 /100 | #335 | Tragic 7.2% |
| Immigrants | Dominican Republic | 0.0 /100 | #336 | Tragic 7.2% |
| Navajo | 0.0 /100 | #337 | Tragic 7.3% |
| Tohono O'odham | 0.0 /100 | #338 | Tragic 7.7% |
| Immigrants | Yemen | 0.0 /100 | #339 | Tragic 7.8% |
| Hopi | 0.0 /100 | #340 | Tragic 8.1% |
| Inupiat | 0.0 /100 | #341 | Tragic 8.2% |
| Puerto Ricans | 0.0 /100 | #342 | Tragic 8.3% |
| Arapaho | 0.0 /100 | #343 | Tragic 8.8% |
| Pima | 0.0 /100 | #344 | Tragic 9.3% |
| Yuman | 0.0 /100 | #345 | Tragic 9.6% |
| Yup'ik | 0.0 /100 | #346 | Tragic 10.9% |