Immigrants from Eritrea vs American Median Male Earnings
COMPARE
Immigrants from Eritrea
American
Median Male Earnings
Median Male Earnings Comparison
Immigrants from Eritrea
Americans
$53,715
MEDIAN MALE EARNINGS
31.8/ 100
METRIC RATING
187th/ 347
METRIC RANK
$50,761
MEDIAN MALE EARNINGS
2.5/ 100
METRIC RATING
239th/ 347
METRIC RANK
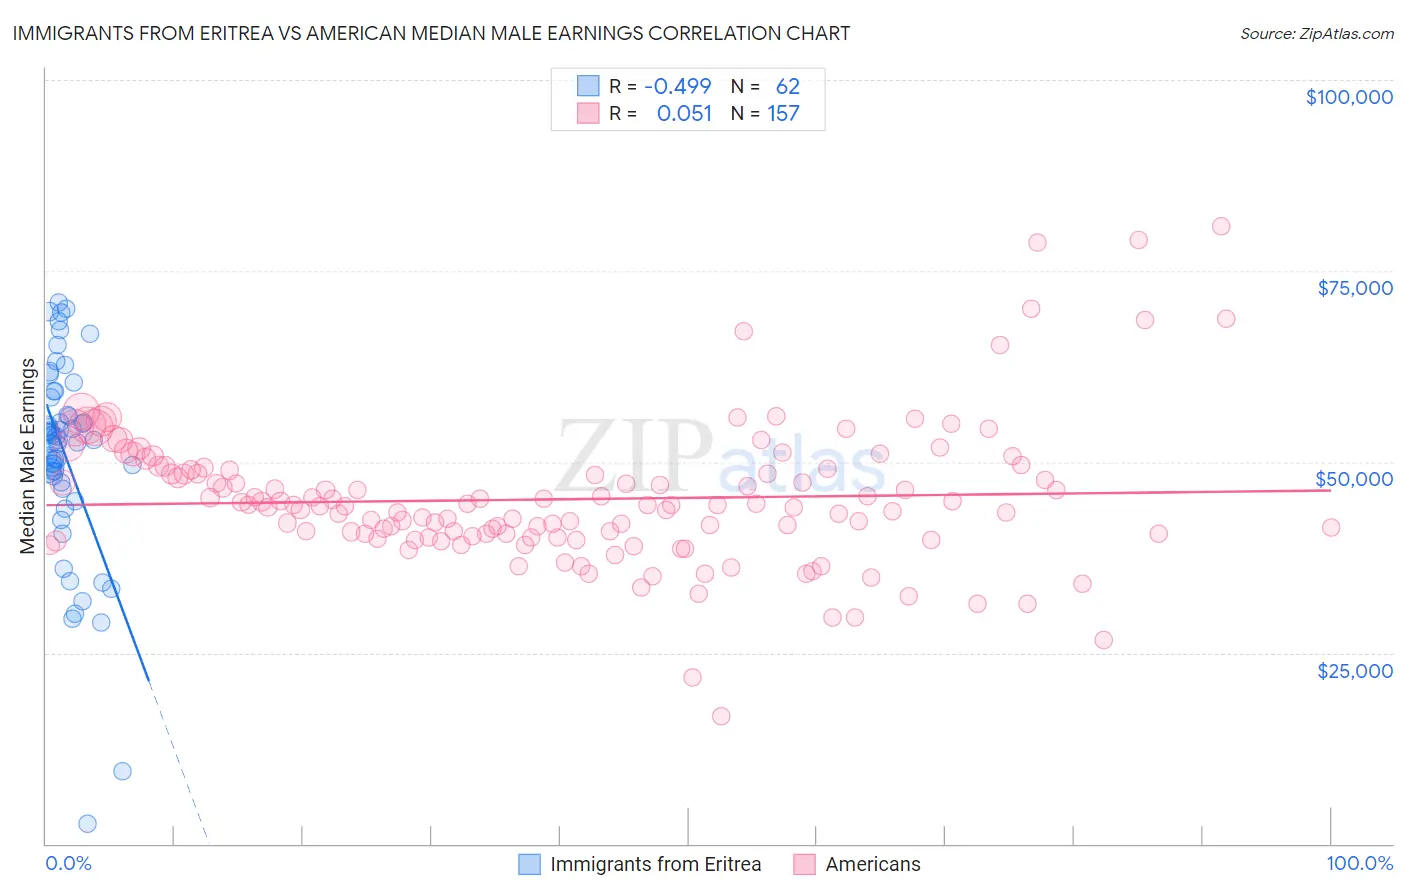
Immigrants from Eritrea vs American Median Male Earnings Correlation Chart
The statistical analysis conducted on geographies consisting of 104,828,804 people shows a moderate negative correlation between the proportion of Immigrants from Eritrea and median male earnings in the United States with a correlation coefficient (R) of -0.499 and weighted average of $53,715. Similarly, the statistical analysis conducted on geographies consisting of 580,042,530 people shows a slight positive correlation between the proportion of Americans and median male earnings in the United States with a correlation coefficient (R) of 0.051 and weighted average of $50,761, a difference of 5.8%.
Median Male Earnings Correlation Summary
| Measurement | Immigrants from Eritrea | American |
| Minimum | $2,614 | $16,756 |
| Maximum | $70,824 | $80,855 |
| Range | $68,210 | $64,099 |
| Mean | $50,677 | $45,104 |
| Median | $52,865 | $44,329 |
| Interquartile 25% (IQ1) | $47,273 | $40,142 |
| Interquartile 75% (IQ3) | $58,480 | $48,927 |
| Interquartile Range (IQR) | $11,207 | $8,785 |
| Standard Deviation (Sample) | $13,241 | $9,213 |
| Standard Deviation (Population) | $13,134 | $9,183 |
Similar Demographics by Median Male Earnings
Demographics Similar to Immigrants from Eritrea by Median Male Earnings
In terms of median male earnings, the demographic groups most similar to Immigrants from Eritrea are Immigrants from Eastern Africa ($53,713, a difference of 0.0%), Puget Sound Salish ($53,704, a difference of 0.020%), Uruguayan ($53,680, a difference of 0.060%), Guamanian/Chamorro ($53,661, a difference of 0.10%), and Scotch-Irish ($53,658, a difference of 0.11%).
| Demographics | Rating | Rank | Median Male Earnings |
| Iraqis | 42.5 /100 | #180 | Average $54,182 |
| Immigrants | Immigrants | 42.1 /100 | #181 | Average $54,168 |
| Yugoslavians | 37.4 /100 | #182 | Fair $53,967 |
| Immigrants | South America | 37.3 /100 | #183 | Fair $53,962 |
| Whites/Caucasians | 36.5 /100 | #184 | Fair $53,925 |
| Immigrants | Sierra Leone | 36.0 /100 | #185 | Fair $53,905 |
| Colombians | 34.4 /100 | #186 | Fair $53,832 |
| Immigrants | Eritrea | 31.8 /100 | #187 | Fair $53,715 |
| Immigrants | Eastern Africa | 31.8 /100 | #188 | Fair $53,713 |
| Puget Sound Salish | 31.6 /100 | #189 | Fair $53,704 |
| Uruguayans | 31.1 /100 | #190 | Fair $53,680 |
| Guamanians/Chamorros | 30.7 /100 | #191 | Fair $53,661 |
| Scotch-Irish | 30.6 /100 | #192 | Fair $53,658 |
| Kenyans | 30.4 /100 | #193 | Fair $53,647 |
| Spanish | 29.0 /100 | #194 | Fair $53,576 |
Demographics Similar to Americans by Median Male Earnings
In terms of median male earnings, the demographic groups most similar to Americans are Malaysian ($50,772, a difference of 0.020%), Immigrants from Barbados ($50,795, a difference of 0.070%), West Indian ($50,682, a difference of 0.16%), Immigrants from St. Vincent and the Grenadines ($50,665, a difference of 0.19%), and Pennsylvania German ($50,878, a difference of 0.23%).
| Demographics | Rating | Rank | Median Male Earnings |
| Sudanese | 3.9 /100 | #232 | Tragic $51,216 |
| Aleuts | 3.7 /100 | #233 | Tragic $51,168 |
| Cape Verdeans | 3.5 /100 | #234 | Tragic $51,103 |
| Immigrants | Western Africa | 3.0 /100 | #235 | Tragic $50,940 |
| Pennsylvania Germans | 2.8 /100 | #236 | Tragic $50,878 |
| Immigrants | Barbados | 2.6 /100 | #237 | Tragic $50,795 |
| Malaysians | 2.5 /100 | #238 | Tragic $50,772 |
| Americans | 2.5 /100 | #239 | Tragic $50,761 |
| West Indians | 2.3 /100 | #240 | Tragic $50,682 |
| Immigrants | St. Vincent and the Grenadines | 2.3 /100 | #241 | Tragic $50,665 |
| Guyanese | 2.2 /100 | #242 | Tragic $50,613 |
| French American Indians | 2.2 /100 | #243 | Tragic $50,611 |
| Houma | 2.0 /100 | #244 | Tragic $50,547 |
| Hawaiians | 1.9 /100 | #245 | Tragic $50,488 |
| Immigrants | Ecuador | 1.9 /100 | #246 | Tragic $50,474 |