Immigrants from South Central Asia vs American Female Unemployment
COMPARE
Immigrants from South Central Asia
American
Female Unemployment
Female Unemployment Comparison
Immigrants from South Central Asia
Americans
5.0%
FEMALE UNEMPLOYMENT
95.5/ 100
METRIC RATING
96th/ 347
METRIC RANK
5.1%
FEMALE UNEMPLOYMENT
90.5/ 100
METRIC RATING
116th/ 347
METRIC RANK
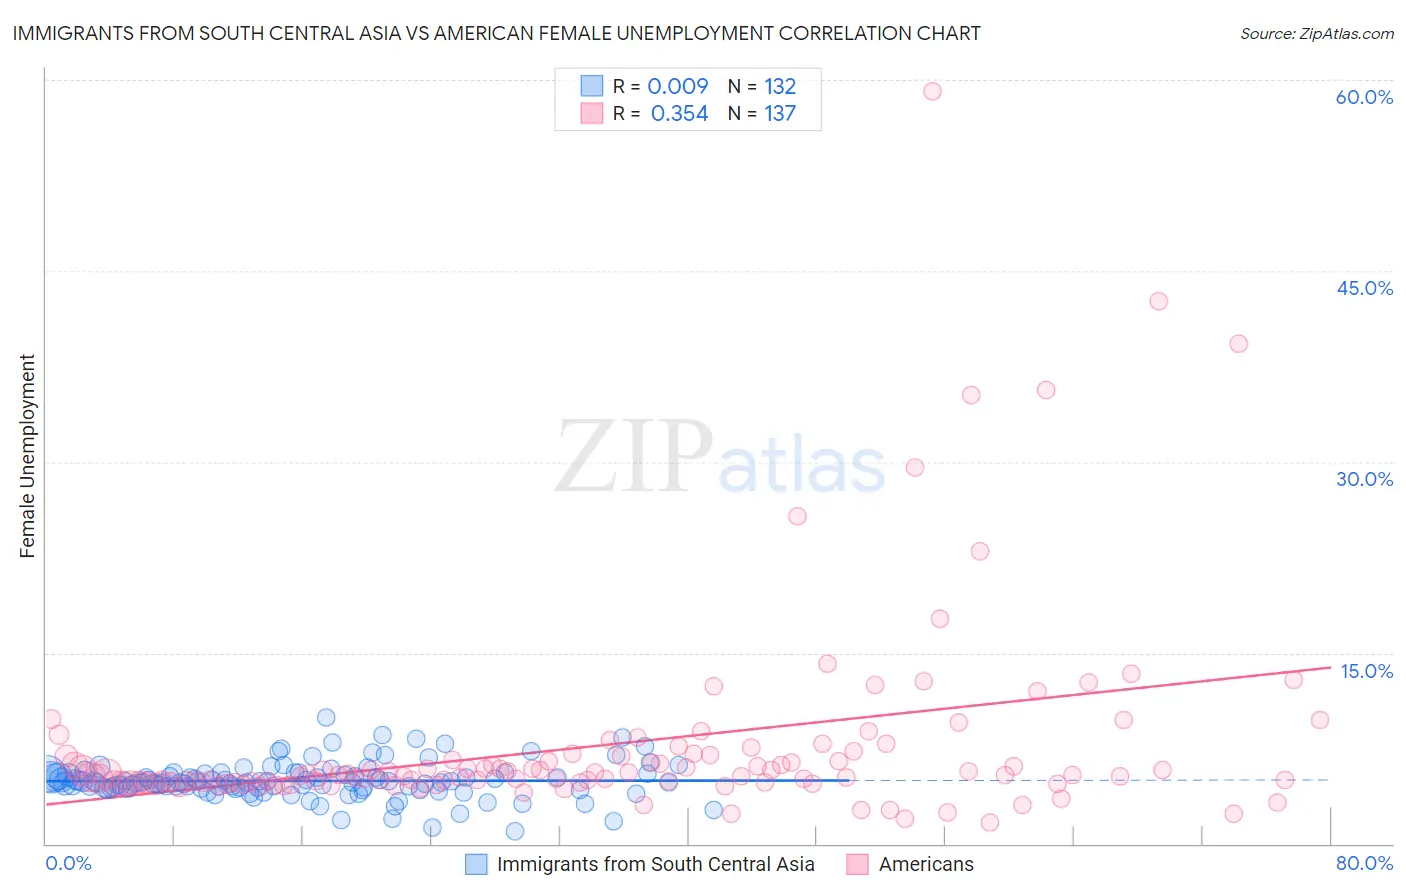
Immigrants from South Central Asia vs American Female Unemployment Correlation Chart
The statistical analysis conducted on geographies consisting of 470,050,410 people shows no correlation between the proportion of Immigrants from South Central Asia and unemploymnet rate among females in the United States with a correlation coefficient (R) of 0.009 and weighted average of 5.0%. Similarly, the statistical analysis conducted on geographies consisting of 565,732,279 people shows a mild positive correlation between the proportion of Americans and unemploymnet rate among females in the United States with a correlation coefficient (R) of 0.354 and weighted average of 5.1%, a difference of 1.3%.
Female Unemployment Correlation Summary
| Measurement | Immigrants from South Central Asia | American |
| Minimum | 1.0% | 1.7% |
| Maximum | 9.9% | 59.1% |
| Range | 8.9% | 57.4% |
| Mean | 4.9% | 7.8% |
| Median | 4.8% | 5.4% |
| Interquartile 25% (IQ1) | 4.4% | 4.8% |
| Interquartile 75% (IQ3) | 5.4% | 6.9% |
| Interquartile Range (IQR) | 1.0% | 2.1% |
| Standard Deviation (Sample) | 1.4% | 8.0% |
| Standard Deviation (Population) | 1.4% | 7.9% |
Demographics Similar to Immigrants from South Central Asia and Americans by Female Unemployment
In terms of female unemployment, the demographic groups most similar to Immigrants from South Central Asia are Immigrants from Somalia (5.0%, a difference of 0.11%), Immigrants from Kuwait (5.0%, a difference of 0.11%), Immigrants from Zaire (5.0%, a difference of 0.12%), Indonesian (5.0%, a difference of 0.14%), and Immigrants from Czechoslovakia (5.0%, a difference of 0.18%). Similarly, the demographic groups most similar to Americans are Lebanese (5.1%, a difference of 0.080%), Immigrants from Turkey (5.1%, a difference of 0.10%), Immigrants from Saudi Arabia (5.1%, a difference of 0.13%), Estonian (5.1%, a difference of 0.31%), and Immigrants from Burma/Myanmar (5.1%, a difference of 0.34%).
| Demographics | Rating | Rank | Female Unemployment |
| Immigrants | South Central Asia | 95.5 /100 | #96 | Exceptional 5.0% |
| Immigrants | Somalia | 95.2 /100 | #97 | Exceptional 5.0% |
| Immigrants | Kuwait | 95.2 /100 | #98 | Exceptional 5.0% |
| Immigrants | Zaire | 95.2 /100 | #99 | Exceptional 5.0% |
| Indonesians | 95.1 /100 | #100 | Exceptional 5.0% |
| Immigrants | Czechoslovakia | 95.0 /100 | #101 | Exceptional 5.0% |
| Immigrants | Kenya | 94.8 /100 | #102 | Exceptional 5.0% |
| Somalis | 94.6 /100 | #103 | Exceptional 5.0% |
| Kenyans | 93.7 /100 | #104 | Exceptional 5.0% |
| Immigrants | England | 93.6 /100 | #105 | Exceptional 5.0% |
| Paraguayans | 93.2 /100 | #106 | Exceptional 5.1% |
| Immigrants | Switzerland | 93.1 /100 | #107 | Exceptional 5.1% |
| Puget Sound Salish | 93.0 /100 | #108 | Exceptional 5.1% |
| Immigrants | Eastern Africa | 92.8 /100 | #109 | Exceptional 5.1% |
| Macedonians | 92.4 /100 | #110 | Exceptional 5.1% |
| Immigrants | Burma/Myanmar | 92.3 /100 | #111 | Exceptional 5.1% |
| Estonians | 92.1 /100 | #112 | Exceptional 5.1% |
| Immigrants | Saudi Arabia | 91.2 /100 | #113 | Exceptional 5.1% |
| Immigrants | Turkey | 91.0 /100 | #114 | Exceptional 5.1% |
| Lebanese | 91.0 /100 | #115 | Exceptional 5.1% |
| Americans | 90.5 /100 | #116 | Exceptional 5.1% |