Immigrants from Eritrea vs Aleut Unemployment
COMPARE
Immigrants from Eritrea
Aleut
Unemployment
Unemployment Comparison
Immigrants from Eritrea
Aleuts
5.0%
UNEMPLOYMENT
93.3/ 100
METRIC RATING
109th/ 347
METRIC RANK
6.1%
UNEMPLOYMENT
0.0/ 100
METRIC RATING
284th/ 347
METRIC RANK
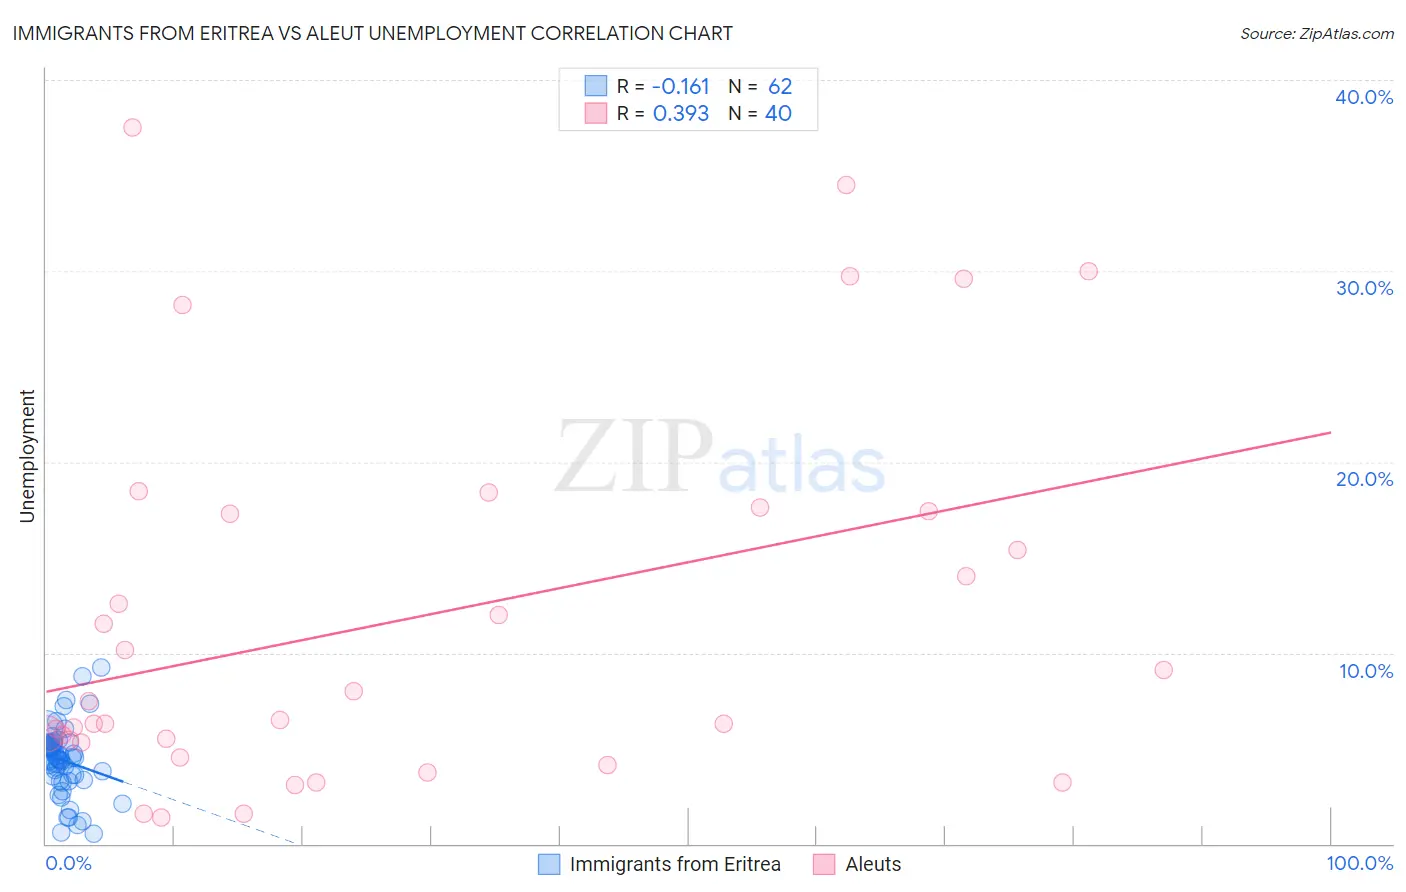
Immigrants from Eritrea vs Aleut Unemployment Correlation Chart
The statistical analysis conducted on geographies consisting of 104,849,484 people shows a poor negative correlation between the proportion of Immigrants from Eritrea and unemployment in the United States with a correlation coefficient (R) of -0.161 and weighted average of 5.0%. Similarly, the statistical analysis conducted on geographies consisting of 61,764,375 people shows a mild positive correlation between the proportion of Aleuts and unemployment in the United States with a correlation coefficient (R) of 0.393 and weighted average of 6.1%, a difference of 20.3%.
Unemployment Correlation Summary
| Measurement | Immigrants from Eritrea | Aleut |
| Minimum | 0.50% | 1.4% |
| Maximum | 9.2% | 37.5% |
| Range | 8.7% | 36.1% |
| Mean | 4.4% | 11.8% |
| Median | 4.5% | 7.0% |
| Interquartile 25% (IQ1) | 3.5% | 5.4% |
| Interquartile 75% (IQ3) | 5.2% | 17.4% |
| Interquartile Range (IQR) | 1.7% | 12.0% |
| Standard Deviation (Sample) | 1.8% | 9.8% |
| Standard Deviation (Population) | 1.7% | 9.7% |
Similar Demographics by Unemployment
Demographics Similar to Immigrants from Eritrea by Unemployment
In terms of unemployment, the demographic groups most similar to Immigrants from Eritrea are Immigrants from Lithuania (5.0%, a difference of 0.020%), Chilean (5.0%, a difference of 0.020%), Immigrants from Kuwait (5.0%, a difference of 0.10%), Immigrants from Turkey (5.0%, a difference of 0.11%), and Immigrants from Romania (5.0%, a difference of 0.12%).
| Demographics | Rating | Rank | Unemployment |
| Immigrants | Argentina | 94.1 /100 | #102 | Exceptional 5.0% |
| Chickasaw | 94.0 /100 | #103 | Exceptional 5.0% |
| Osage | 94.0 /100 | #104 | Exceptional 5.0% |
| Maltese | 94.0 /100 | #105 | Exceptional 5.0% |
| Immigrants | Romania | 93.7 /100 | #106 | Exceptional 5.0% |
| Immigrants | Turkey | 93.7 /100 | #107 | Exceptional 5.0% |
| Immigrants | Kuwait | 93.7 /100 | #108 | Exceptional 5.0% |
| Immigrants | Eritrea | 93.3 /100 | #109 | Exceptional 5.0% |
| Immigrants | Lithuania | 93.2 /100 | #110 | Exceptional 5.0% |
| Chileans | 93.2 /100 | #111 | Exceptional 5.0% |
| South Africans | 92.6 /100 | #112 | Exceptional 5.1% |
| Argentineans | 92.4 /100 | #113 | Exceptional 5.1% |
| Immigrants | Ireland | 92.1 /100 | #114 | Exceptional 5.1% |
| Immigrants | Western Europe | 91.1 /100 | #115 | Exceptional 5.1% |
| Immigrants | Sri Lanka | 91.1 /100 | #116 | Exceptional 5.1% |
Demographics Similar to Aleuts by Unemployment
In terms of unemployment, the demographic groups most similar to Aleuts are Immigrants from Ghana (6.1%, a difference of 0.13%), Immigrants from the Azores (6.1%, a difference of 0.21%), African (6.1%, a difference of 0.28%), Immigrants from Mexico (6.0%, a difference of 0.86%), and Immigrants from Western Africa (6.0%, a difference of 0.86%).
| Demographics | Rating | Rank | Unemployment |
| Armenians | 0.0 /100 | #277 | Tragic 6.0% |
| Ghanaians | 0.0 /100 | #278 | Tragic 6.0% |
| Immigrants | Mexico | 0.0 /100 | #279 | Tragic 6.0% |
| Immigrants | Western Africa | 0.0 /100 | #280 | Tragic 6.0% |
| Africans | 0.0 /100 | #281 | Tragic 6.1% |
| Immigrants | Azores | 0.0 /100 | #282 | Tragic 6.1% |
| Immigrants | Ghana | 0.0 /100 | #283 | Tragic 6.1% |
| Aleuts | 0.0 /100 | #284 | Tragic 6.1% |
| Immigrants | Senegal | 0.0 /100 | #285 | Tragic 6.1% |
| Immigrants | Caribbean | 0.0 /100 | #286 | Tragic 6.2% |
| Nepalese | 0.0 /100 | #287 | Tragic 6.2% |
| Ecuadorians | 0.0 /100 | #288 | Tragic 6.2% |
| Chippewa | 0.0 /100 | #289 | Tragic 6.2% |
| Senegalese | 0.0 /100 | #290 | Tragic 6.2% |
| Haitians | 0.0 /100 | #291 | Tragic 6.2% |