Immigrants from Egypt vs Aleut Unemployment

COMPARE

Immigrants from Egypt
Race
Ancestry
AfghanAfricanAlaska NativeAlaskan AthabascanAlbanianAlsatianAmericanApacheArabArapahoArgentineanArmenianAssyrian/Chaldean/SyriacAustralianAustrianBahamianBangladeshiBarbadianBasqueBelgianBelizeanBermudanBhutaneseBlackfeetBolivianBrazilianBritishBritish West IndianBulgarianBurmeseCajunCambodianCanadianCape VerdeanCarpatho RusynCelticCentral AmericanCentral American IndianCherokeeCheyenneChickasawChileanChineseChippewaChoctawColombianColvilleComancheCosta RicanCreeCreekCroatianCrowCubanCypriotCzechCzechoslovakianDanishDelawareDominicanDutchDutch West IndianEastern EuropeanEcuadorianEgyptianEnglishEstonianEthiopianEuropeanFijianFilipinoFinnishFrenchFrench American IndianFrench CanadianGermanGerman RussianGhanaianGreekGuamanian/ChamorroGuatemalanGuyaneseHaitianHmongHonduranHopiHoumaHungarianIcelanderIndian (Asian)IndonesianInupiatIranianIraqiIrishIroquoisIsraeliItalianJamaicanJapaneseJordanianKenyanKiowaKoreanLaotianLatvianLebaneseLiberianLithuanianLumbeeLuxembourgerMacedonianMalaysianMalteseMarshalleseMenomineeMexicanMexican American IndianMongolianMoroccanNative HawaiianNavajoNepaleseNew ZealanderNicaraguanNigerianNorthern EuropeanNorwegianOkinawanOsageOttawaPaiutePakistaniPalestinianPanamanianParaguayanPennsylvania GermanPeruvianPimaPolishPortuguesePotawatomiPuebloPuerto RicanPuget Sound SalishRomanianRussianSalvadoranSamoanScandinavianScotch-IrishScottishSeminoleSenegaleseSerbianShoshoneSierra LeoneanSiouxSlavicSlovakSloveneSomaliSouth AfricanSouth AmericanSouth American IndianSoviet UnionSpaniardSpanishSpanish AmericanSpanish American IndianSri LankanSubsaharan AfricanSudaneseSwedishSwissSyrianTaiwaneseThaiTlingit-HaidaTohono O'OdhamTonganTrinidadian and TobagonianTsimshianTurkishU.S. Virgin IslanderUgandanUkrainianUruguayanUteVenezuelanVietnameseWelshWest IndianYakamaYaquiYugoslavianYumanYup'ikZimbabwean
Immigration
NonimmigrantsImmigrantsAfghanistanAfricaAlbaniaArgentinaArmeniaAsiaAustraliaAustriaBahamasBangladeshBarbadosBelarusBelgiumBelizeBoliviaBosnia and HerzegovinaBrazilBulgariaBurma/MyanmarCabo VerdeCambodiaCameroonCanadaCaribbeanCentral AmericaChileChinaColombiaCongoCosta RicaCroatiaCubaCzechoslovakiaDenmarkDominicaDominican RepublicEastern AfricaEastern AsiaEastern EuropeEcuadorEgyptEl SalvadorEnglandEritreaEthiopiaEuropeFijiFranceGermanyGhanaGreeceGrenadaGuatemalaGuyanaHaitiHondurasHong KongHungaryIndiaIndonesiaIranIraqIrelandIsraelItalyJamaicaJapanJordanKazakhstanKenyaKoreaKuwaitLaosLatin AmericaLatviaLebanonLiberiaLithuaniaMalaysiaMexicoMicronesiaMiddle AfricaMoldovaMoroccoNepalNetherlandsNicaraguaNigeriaNorth AmericaNorth MacedoniaNorthern AfricaNorthern EuropeNorwayOceaniaPakistanPanamaPeruPhilippinesPolandPortugalRomaniaRussiaSaudi ArabiaScotlandSenegalSerbiaSierra LeoneSingaporeSomaliaSouth AfricaSouth AmericaSouth Central AsiaSouth Eastern AsiaSouthern EuropeSpainSri LankaSt. Vincent and the GrenadinesSudanSwedenSwitzerlandSyriaTaiwanThailandTrinidad and TobagoTurkeyUgandaUkraineUruguayUzbekistanVenezuelaVietnamWest IndiesWestern AfricaWestern AsiaWestern EuropeYemenZaireZimbabweAzores
Aleut
Race
Ancestry
AfghanAfricanAlaska NativeAlaskan AthabascanAlbanianAleutAlsatianAmericanApacheArabArapahoArgentineanArmenianAssyrian/Chaldean/SyriacAustralianAustrianBahamianBangladeshiBarbadianBasqueBelgianBelizeanBermudanBhutaneseBlackfeetBolivianBrazilianBritishBritish West IndianBulgarianBurmeseCajunCambodianCanadianCape VerdeanCarpatho RusynCelticCentral AmericanCentral American IndianCherokeeCheyenneChickasawChileanChineseChippewaChoctawColombianColvilleComancheCosta RicanCreeCreekCroatianCrowCubanCypriotCzechCzechoslovakianDanishDelawareDominicanDutchDutch West IndianEastern EuropeanEcuadorianEgyptianEnglishEstonianEthiopianEuropeanFijianFilipinoFinnishFrenchFrench American IndianFrench CanadianGermanGerman RussianGhanaianGreekGuamanian/ChamorroGuatemalanGuyaneseHaitianHmongHonduranHopiHoumaHungarianIcelanderIndian (Asian)IndonesianInupiatIranianIraqiIrishIroquoisIsraeliItalianJamaicanJapaneseJordanianKenyanKiowaKoreanLaotianLatvianLebaneseLiberianLithuanianLumbeeLuxembourgerMacedonianMalaysianMalteseMarshalleseMenomineeMexicanMexican American IndianMongolianMoroccanNative HawaiianNavajoNepaleseNew ZealanderNicaraguanNigerianNorthern EuropeanNorwegianOkinawanOsageOttawaPaiutePakistaniPalestinianPanamanianParaguayanPennsylvania GermanPeruvianPimaPolishPortuguesePotawatomiPuebloPuerto RicanPuget Sound SalishRomanianRussianSalvadoranSamoanScandinavianScotch-IrishScottishSeminoleSenegaleseSerbianShoshoneSierra LeoneanSiouxSlavicSlovakSloveneSomaliSouth AfricanSouth AmericanSouth American IndianSoviet UnionSpaniardSpanishSpanish AmericanSpanish American IndianSri LankanSubsaharan AfricanSudaneseSwedishSwissSyrianTaiwaneseThaiTlingit-HaidaTohono O'OdhamTonganTrinidadian and TobagonianTsimshianTurkishU.S. Virgin IslanderUgandanUkrainianUruguayanUteVenezuelanVietnameseWelshWest IndianYakamaYaquiYugoslavianYumanYup'ikZimbabwean
Immigration
NonimmigrantsImmigrantsAfghanistanAfricaAlbaniaArgentinaArmeniaAsiaAustraliaAustriaBahamasBangladeshBarbadosBelarusBelgiumBelizeBoliviaBosnia and HerzegovinaBrazilBulgariaBurma/MyanmarCabo VerdeCambodiaCameroonCanadaCaribbeanCentral AmericaChileChinaColombiaCongoCosta RicaCroatiaCubaCzechoslovakiaDenmarkDominicaDominican RepublicEastern AfricaEastern AsiaEastern EuropeEcuadorEl SalvadorEnglandEritreaEthiopiaEuropeFijiFranceGermanyGhanaGreeceGrenadaGuatemalaGuyanaHaitiHondurasHong KongHungaryIndiaIndonesiaIranIraqIrelandIsraelItalyJamaicaJapanJordanKazakhstanKenyaKoreaKuwaitLaosLatin AmericaLatviaLebanonLiberiaLithuaniaMalaysiaMexicoMicronesiaMiddle AfricaMoldovaMoroccoNepalNetherlandsNicaraguaNigeriaNorth AmericaNorth MacedoniaNorthern AfricaNorthern EuropeNorwayOceaniaPakistanPanamaPeruPhilippinesPolandPortugalRomaniaRussiaSaudi ArabiaScotlandSenegalSerbiaSierra LeoneSingaporeSomaliaSouth AfricaSouth AmericaSouth Central AsiaSouth Eastern AsiaSouthern EuropeSpainSri LankaSt. Vincent and the GrenadinesSudanSwedenSwitzerlandSyriaTaiwanThailandTrinidad and TobagoTurkeyUgandaUkraineUruguayUzbekistanVenezuelaVietnamWest IndiesWestern AfricaWestern AsiaWestern EuropeYemenZaireZimbabweAzores
Unemployment
Income
Poverty
Unemployment
Labor Participation
Family Structure
Vehicle Availability
Education Level
Disability

Unemployment Comparison

Immigrants from Egypt

Aleuts

Good
Tragic
5.2%
UNEMPLOYMENT
66.7/ 100
METRIC RATING
158th/ 347
METRIC RANK
6.1%
UNEMPLOYMENT
0.0/ 100
METRIC RATING
284th/ 347
METRIC RANK

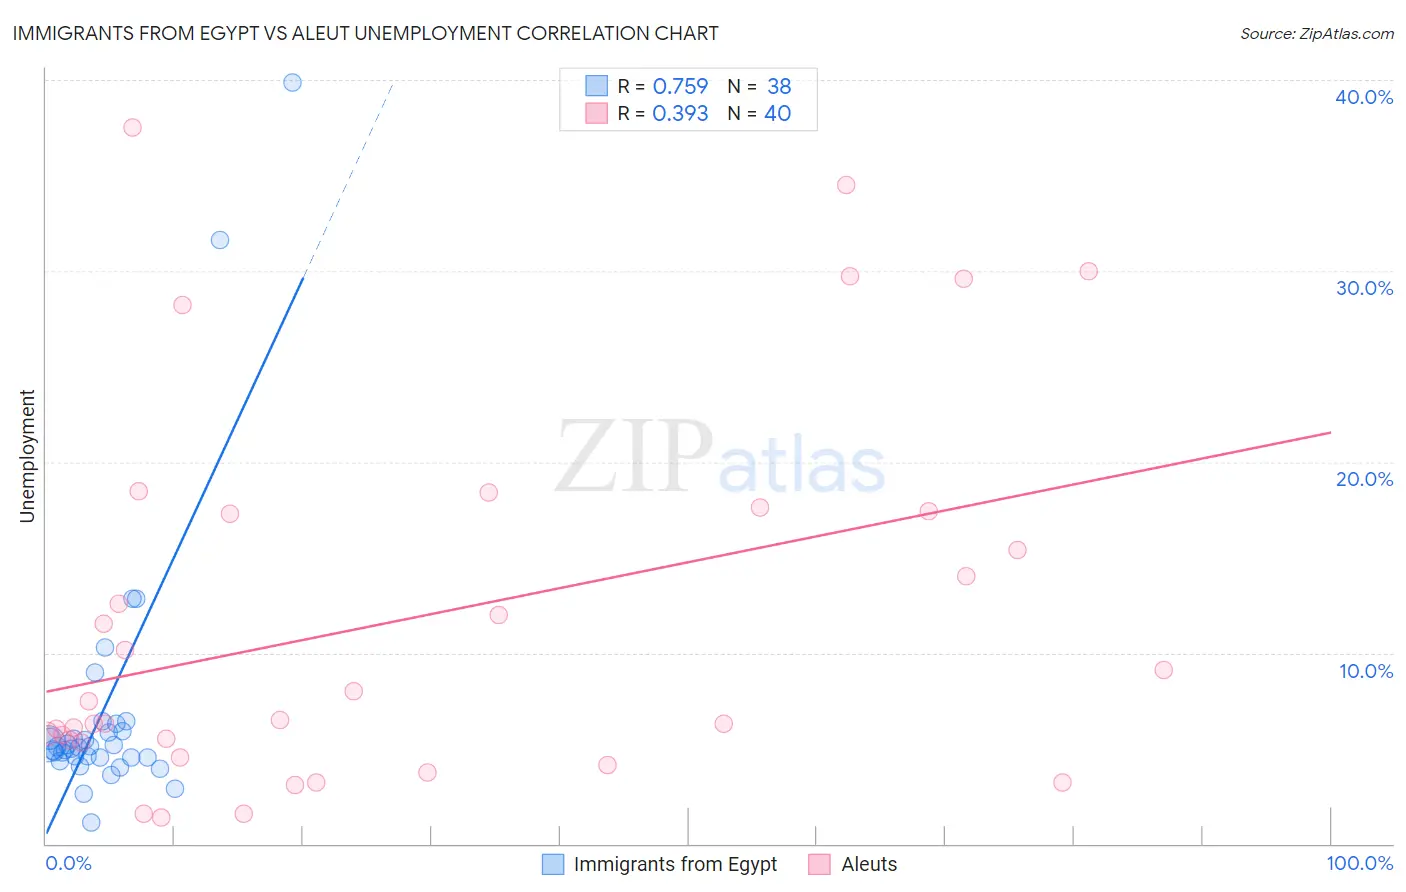
Immigrants from Egypt vs Aleut Unemployment Correlation Chart

The statistical analysis conducted on geographies consisting of 245,443,113 people shows a strong positive correlation between the proportion of Immigrants from Egypt and unemployment in the United States with a correlation coefficient (R) of 0.759 and weighted average of 5.2%. Similarly, the statistical analysis conducted on geographies consisting of 61,764,375 people shows a mild positive correlation between the proportion of Aleuts and unemployment in the United States with a correlation coefficient (R) of 0.393 and weighted average of 6.1%, a difference of 16.7%.
Immigrants from Egypt vs Aleut Unemployment

Unemployment Correlation Summary

MeasurementImmigrants from EgyptAleut
Minimum1.1%1.4%
Maximum39.9%37.5%
Range38.8%36.1%
Mean7.1%11.8%
Median5.0%7.0%
Interquartile 25% (IQ1)4.5%5.4%
Interquartile 75% (IQ3)5.9%17.4%
Interquartile Range (IQR)1.4%12.0%
Standard Deviation (Sample)7.3%9.8%
Standard Deviation (Population)7.2%9.7%

Similar Demographics by Unemployment

Demographics Similar to Immigrants from Egypt by Unemployment

In terms of unemployment, the demographic groups most similar to Immigrants from Egypt are Immigrants from Russia (5.2%, a difference of 0.0%), Laotian (5.2%, a difference of 0.020%), Immigrants from Oceania (5.2%, a difference of 0.10%), Spanish (5.2%, a difference of 0.11%), and Immigrants from Zaire (5.2%, a difference of 0.13%).
DemographicsRating | RankUnemployment
Immigrants | Eastern Europe
75.3
/100
|
#151
Good
5.2%
Immigrants | Hong Kong
75.2
/100
|
#152
Good
5.2%
Egyptians
75.2
/100
|
#153
Good
5.2%
Immigrants | China
74.7
/100
|
#154
Good
5.2%
Immigrants | Northern Africa
71.3
/100
|
#155
Good
5.2%
Immigrants | Kazakhstan
70.4
/100
|
#156
Good
5.2%
Sri Lankans
69.5
/100
|
#157
Good
5.2%
Immigrants | Egypt
66.7
/100
|
#158
Good
5.2%
Immigrants | Russia
66.6
/100
|
#159
Good
5.2%
Laotians
66.3
/100
|
#160
Good
5.2%
Immigrants | Oceania
65.2
/100
|
#161
Good
5.2%
Spanish
65.1
/100
|
#162
Good
5.2%
Immigrants | Zaire
64.7
/100
|
#163
Good
5.2%
Immigrants | Colombia
64.7
/100
|
#164
Good
5.2%
Immigrants | Brazil
63.1
/100
|
#165
Good
5.2%

Demographics Similar to Aleuts by Unemployment

In terms of unemployment, the demographic groups most similar to Aleuts are Immigrants from Ghana (6.1%, a difference of 0.13%), Immigrants from the Azores (6.1%, a difference of 0.21%), African (6.1%, a difference of 0.28%), Immigrants from Mexico (6.0%, a difference of 0.86%), and Immigrants from Western Africa (6.0%, a difference of 0.86%).
DemographicsRating | RankUnemployment
Armenians
0.0
/100
|
#277
Tragic
6.0%
Ghanaians
0.0
/100
|
#278
Tragic
6.0%
Immigrants | Mexico
0.0
/100
|
#279
Tragic
6.0%
Immigrants | Western Africa
0.0
/100
|
#280
Tragic
6.0%
Africans
0.0
/100
|
#281
Tragic
6.1%
Immigrants | Azores
0.0
/100
|
#282
Tragic
6.1%
Immigrants | Ghana
0.0
/100
|
#283
Tragic
6.1%
Aleuts
0.0
/100
|
#284
Tragic
6.1%
Immigrants | Senegal
0.0
/100
|
#285
Tragic
6.1%
Immigrants | Caribbean
0.0
/100
|
#286
Tragic
6.2%
Nepalese
0.0
/100
|
#287
Tragic
6.2%
Ecuadorians
0.0
/100
|
#288
Tragic
6.2%
Chippewa
0.0
/100
|
#289
Tragic
6.2%
Senegalese
0.0
/100
|
#290
Tragic
6.2%
Haitians
0.0
/100
|
#291
Tragic
6.2%