Canadian vs Aleut Unemployment
COMPARE
Canadian
Aleut
Unemployment
Unemployment Comparison
Canadians
Aleuts
5.0%
UNEMPLOYMENT
97.7/ 100
METRIC RATING
79th/ 347
METRIC RANK
6.1%
UNEMPLOYMENT
0.0/ 100
METRIC RATING
284th/ 347
METRIC RANK
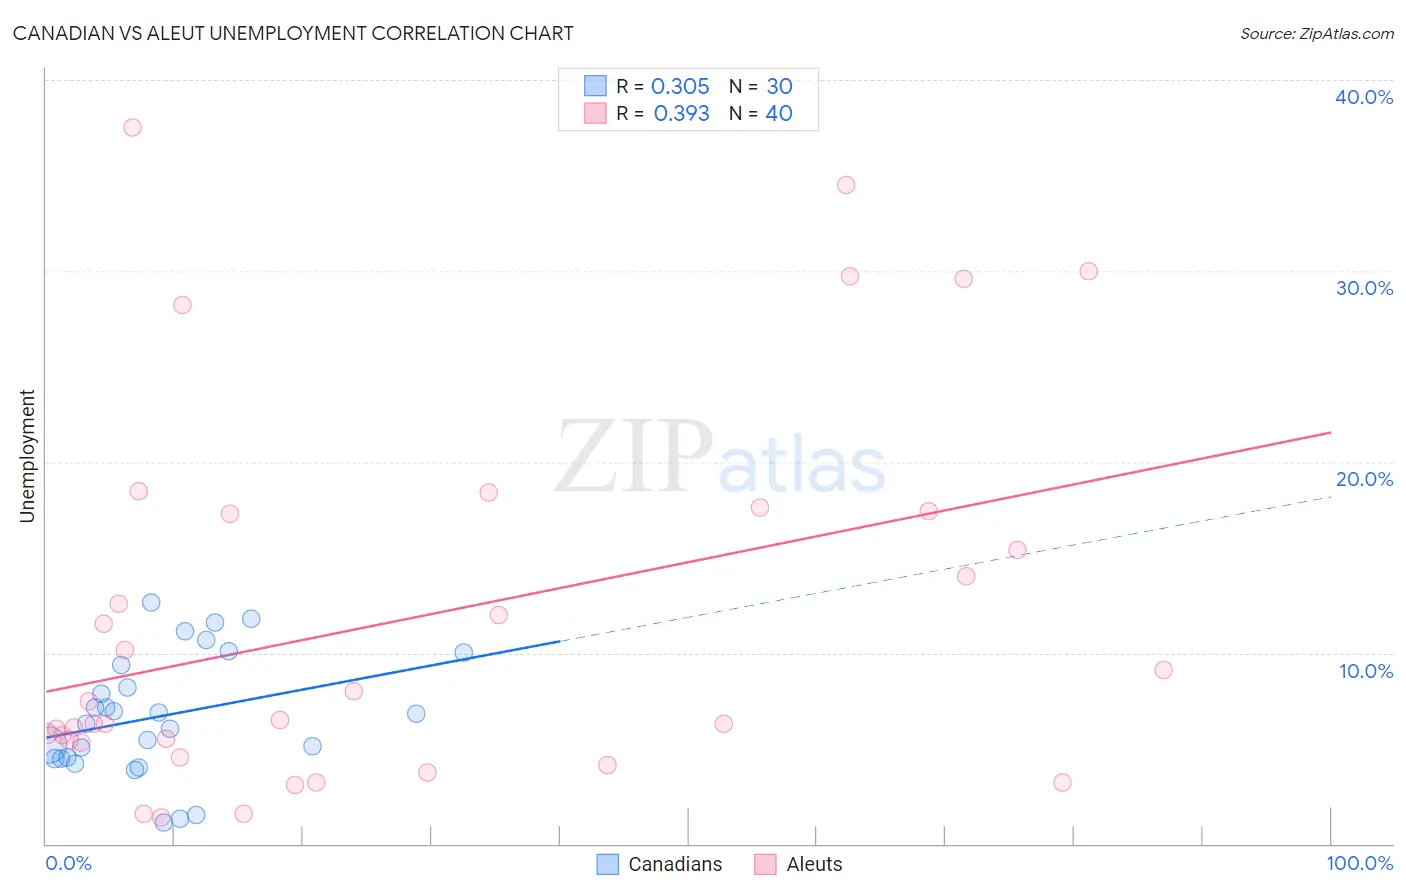
Canadian vs Aleut Unemployment Correlation Chart
The statistical analysis conducted on geographies consisting of 436,779,128 people shows a mild positive correlation between the proportion of Canadians and unemployment in the United States with a correlation coefficient (R) of 0.305 and weighted average of 5.0%. Similarly, the statistical analysis conducted on geographies consisting of 61,764,375 people shows a mild positive correlation between the proportion of Aleuts and unemployment in the United States with a correlation coefficient (R) of 0.393 and weighted average of 6.1%, a difference of 22.5%.
Unemployment Correlation Summary
| Measurement | Canadian | Aleut |
| Minimum | 1.1% | 1.4% |
| Maximum | 12.6% | 37.5% |
| Range | 11.5% | 36.1% |
| Mean | 6.7% | 11.8% |
| Median | 6.6% | 7.0% |
| Interquartile 25% (IQ1) | 4.5% | 5.4% |
| Interquartile 75% (IQ3) | 9.4% | 17.4% |
| Interquartile Range (IQR) | 4.9% | 12.0% |
| Standard Deviation (Sample) | 3.2% | 9.8% |
| Standard Deviation (Population) | 3.1% | 9.7% |
Similar Demographics by Unemployment
Demographics Similar to Canadians by Unemployment
In terms of unemployment, the demographic groups most similar to Canadians are Immigrants from Sweden (5.0%, a difference of 0.070%), Basque (5.0%, a difference of 0.080%), Fijian (5.0%, a difference of 0.090%), Hmong (5.0%, a difference of 0.10%), and Okinawan (4.9%, a difference of 0.12%).
| Demographics | Rating | Rank | Unemployment |
| Burmese | 98.3 /100 | #72 | Exceptional 4.9% |
| Paraguayans | 98.3 /100 | #73 | Exceptional 4.9% |
| Immigrants | Northern Europe | 98.2 /100 | #74 | Exceptional 4.9% |
| Turks | 98.0 /100 | #75 | Exceptional 4.9% |
| German Russians | 98.0 /100 | #76 | Exceptional 4.9% |
| Cypriots | 97.9 /100 | #77 | Exceptional 4.9% |
| Okinawans | 97.9 /100 | #78 | Exceptional 4.9% |
| Canadians | 97.7 /100 | #79 | Exceptional 5.0% |
| Immigrants | Sweden | 97.6 /100 | #80 | Exceptional 5.0% |
| Basques | 97.6 /100 | #81 | Exceptional 5.0% |
| Fijians | 97.6 /100 | #82 | Exceptional 5.0% |
| Hmong | 97.6 /100 | #83 | Exceptional 5.0% |
| Russians | 97.4 /100 | #84 | Exceptional 5.0% |
| Immigrants | Australia | 97.0 /100 | #85 | Exceptional 5.0% |
| Hungarians | 96.9 /100 | #86 | Exceptional 5.0% |
Demographics Similar to Aleuts by Unemployment
In terms of unemployment, the demographic groups most similar to Aleuts are Immigrants from Ghana (6.1%, a difference of 0.13%), Immigrants from the Azores (6.1%, a difference of 0.21%), African (6.1%, a difference of 0.28%), Immigrants from Mexico (6.0%, a difference of 0.86%), and Immigrants from Western Africa (6.0%, a difference of 0.86%).
| Demographics | Rating | Rank | Unemployment |
| Armenians | 0.0 /100 | #277 | Tragic 6.0% |
| Ghanaians | 0.0 /100 | #278 | Tragic 6.0% |
| Immigrants | Mexico | 0.0 /100 | #279 | Tragic 6.0% |
| Immigrants | Western Africa | 0.0 /100 | #280 | Tragic 6.0% |
| Africans | 0.0 /100 | #281 | Tragic 6.1% |
| Immigrants | Azores | 0.0 /100 | #282 | Tragic 6.1% |
| Immigrants | Ghana | 0.0 /100 | #283 | Tragic 6.1% |
| Aleuts | 0.0 /100 | #284 | Tragic 6.1% |
| Immigrants | Senegal | 0.0 /100 | #285 | Tragic 6.1% |
| Immigrants | Caribbean | 0.0 /100 | #286 | Tragic 6.2% |
| Nepalese | 0.0 /100 | #287 | Tragic 6.2% |
| Ecuadorians | 0.0 /100 | #288 | Tragic 6.2% |
| Chippewa | 0.0 /100 | #289 | Tragic 6.2% |
| Senegalese | 0.0 /100 | #290 | Tragic 6.2% |
| Haitians | 0.0 /100 | #291 | Tragic 6.2% |