Immigrants from Norway vs Aleut Unemployment
COMPARE
Immigrants from Norway
Aleut
Unemployment
Unemployment Comparison
Immigrants from Norway
Aleuts
5.1%
UNEMPLOYMENT
81.8/ 100
METRIC RATING
145th/ 347
METRIC RANK
6.1%
UNEMPLOYMENT
0.0/ 100
METRIC RATING
284th/ 347
METRIC RANK
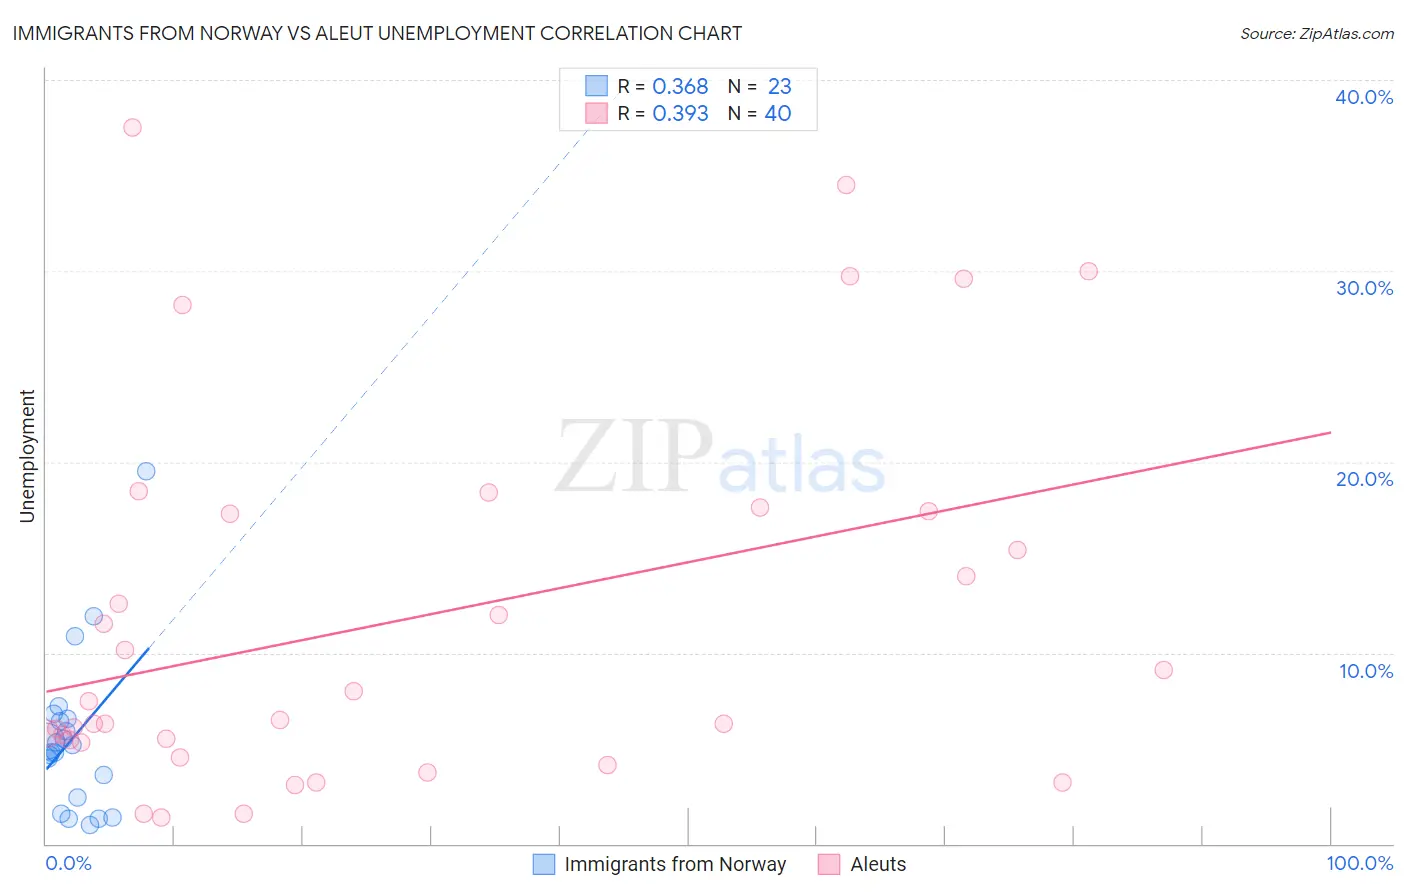
Immigrants from Norway vs Aleut Unemployment Correlation Chart
The statistical analysis conducted on geographies consisting of 116,646,902 people shows a mild positive correlation between the proportion of Immigrants from Norway and unemployment in the United States with a correlation coefficient (R) of 0.368 and weighted average of 5.1%. Similarly, the statistical analysis conducted on geographies consisting of 61,764,375 people shows a mild positive correlation between the proportion of Aleuts and unemployment in the United States with a correlation coefficient (R) of 0.393 and weighted average of 6.1%, a difference of 18.2%.
Unemployment Correlation Summary
| Measurement | Immigrants from Norway | Aleut |
| Minimum | 1.0% | 1.4% |
| Maximum | 19.5% | 37.5% |
| Range | 18.5% | 36.1% |
| Mean | 5.6% | 11.8% |
| Median | 5.2% | 7.0% |
| Interquartile 25% (IQ1) | 2.4% | 5.4% |
| Interquartile 75% (IQ3) | 6.5% | 17.4% |
| Interquartile Range (IQR) | 4.1% | 12.0% |
| Standard Deviation (Sample) | 4.1% | 9.8% |
| Standard Deviation (Population) | 4.0% | 9.7% |
Similar Demographics by Unemployment
Demographics Similar to Immigrants from Norway by Unemployment
In terms of unemployment, the demographic groups most similar to Immigrants from Norway are Immigrants from Asia (5.1%, a difference of 0.0%), Indian (Asian) (5.1%, a difference of 0.020%), Indonesian (5.1%, a difference of 0.050%), Immigrants from Chile (5.1%, a difference of 0.11%), and Immigrants from Pakistan (5.1%, a difference of 0.15%).
| Demographics | Rating | Rank | Unemployment |
| Immigrants | Hungary | 85.6 /100 | #138 | Excellent 5.1% |
| Pakistanis | 85.3 /100 | #139 | Excellent 5.1% |
| Immigrants | Denmark | 84.3 /100 | #140 | Excellent 5.1% |
| Palestinians | 83.4 /100 | #141 | Excellent 5.1% |
| Immigrants | Pakistan | 83.2 /100 | #142 | Excellent 5.1% |
| Immigrants | Chile | 82.8 /100 | #143 | Excellent 5.1% |
| Indonesians | 82.3 /100 | #144 | Excellent 5.1% |
| Immigrants | Norway | 81.8 /100 | #145 | Excellent 5.1% |
| Immigrants | Asia | 81.8 /100 | #146 | Excellent 5.1% |
| Indians (Asian) | 81.6 /100 | #147 | Excellent 5.1% |
| Immigrants | Italy | 79.1 /100 | #148 | Good 5.1% |
| Syrians | 77.7 /100 | #149 | Good 5.2% |
| Potawatomi | 76.2 /100 | #150 | Good 5.2% |
| Immigrants | Eastern Europe | 75.3 /100 | #151 | Good 5.2% |
| Immigrants | Hong Kong | 75.2 /100 | #152 | Good 5.2% |
Demographics Similar to Aleuts by Unemployment
In terms of unemployment, the demographic groups most similar to Aleuts are Immigrants from Ghana (6.1%, a difference of 0.13%), Immigrants from the Azores (6.1%, a difference of 0.21%), African (6.1%, a difference of 0.28%), Immigrants from Mexico (6.0%, a difference of 0.86%), and Immigrants from Western Africa (6.0%, a difference of 0.86%).
| Demographics | Rating | Rank | Unemployment |
| Armenians | 0.0 /100 | #277 | Tragic 6.0% |
| Ghanaians | 0.0 /100 | #278 | Tragic 6.0% |
| Immigrants | Mexico | 0.0 /100 | #279 | Tragic 6.0% |
| Immigrants | Western Africa | 0.0 /100 | #280 | Tragic 6.0% |
| Africans | 0.0 /100 | #281 | Tragic 6.1% |
| Immigrants | Azores | 0.0 /100 | #282 | Tragic 6.1% |
| Immigrants | Ghana | 0.0 /100 | #283 | Tragic 6.1% |
| Aleuts | 0.0 /100 | #284 | Tragic 6.1% |
| Immigrants | Senegal | 0.0 /100 | #285 | Tragic 6.1% |
| Immigrants | Caribbean | 0.0 /100 | #286 | Tragic 6.2% |
| Nepalese | 0.0 /100 | #287 | Tragic 6.2% |
| Ecuadorians | 0.0 /100 | #288 | Tragic 6.2% |
| Chippewa | 0.0 /100 | #289 | Tragic 6.2% |
| Senegalese | 0.0 /100 | #290 | Tragic 6.2% |
| Haitians | 0.0 /100 | #291 | Tragic 6.2% |