Immigrants from Eastern Europe vs English Unemployment
COMPARE
Immigrants from Eastern Europe
English
Unemployment
Unemployment Comparison
Immigrants from Eastern Europe
English
5.2%
UNEMPLOYMENT
75.3/ 100
METRIC RATING
151st/ 347
METRIC RANK
4.6%
UNEMPLOYMENT
100.0/ 100
METRIC RATING
11th/ 347
METRIC RANK
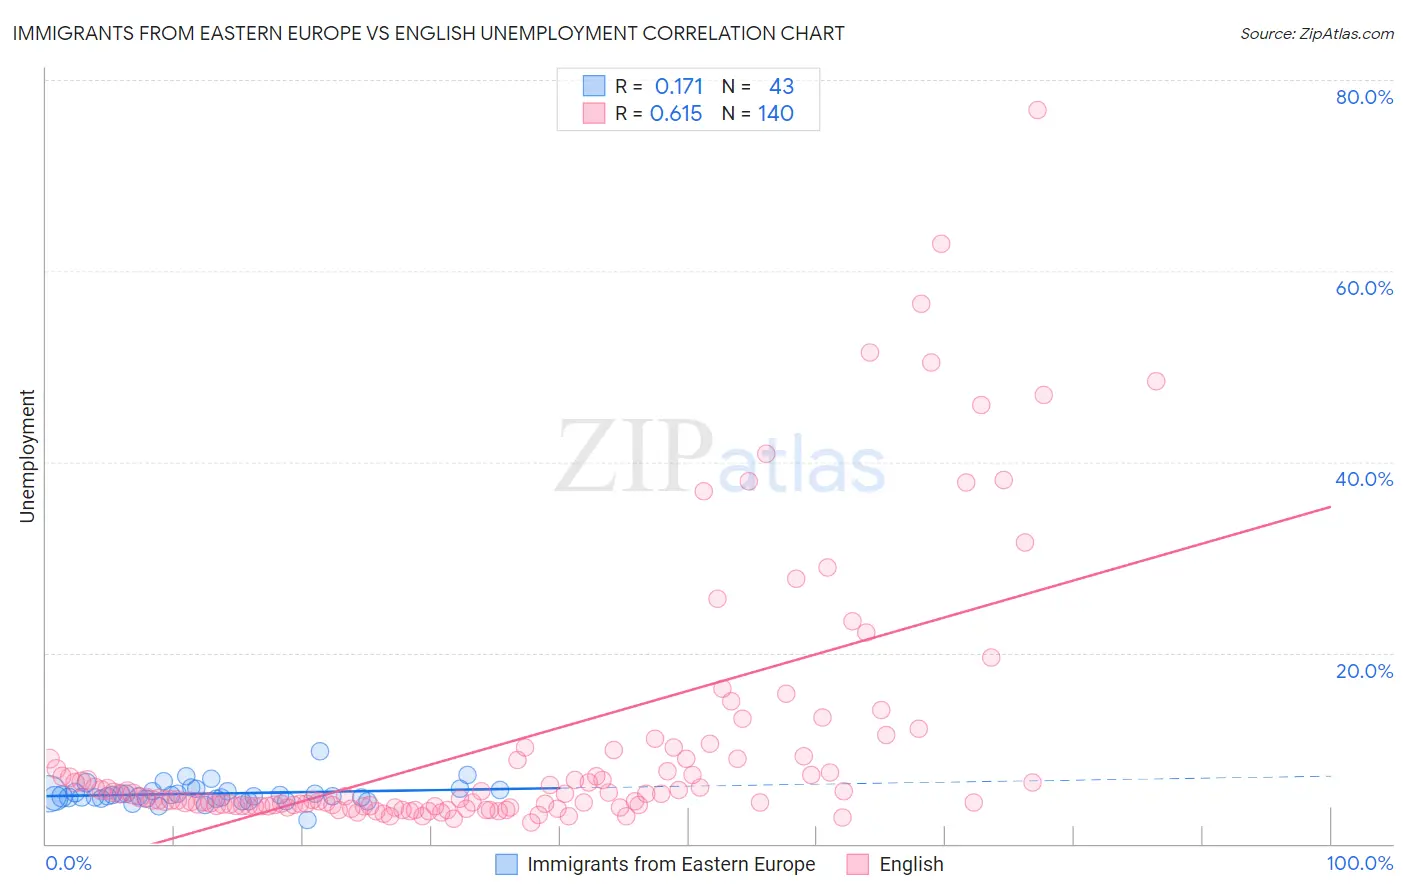
Immigrants from Eastern Europe vs English Unemployment Correlation Chart
The statistical analysis conducted on geographies consisting of 474,836,774 people shows a poor positive correlation between the proportion of Immigrants from Eastern Europe and unemployment in the United States with a correlation coefficient (R) of 0.171 and weighted average of 5.2%. Similarly, the statistical analysis conducted on geographies consisting of 574,199,976 people shows a significant positive correlation between the proportion of English and unemployment in the United States with a correlation coefficient (R) of 0.615 and weighted average of 4.6%, a difference of 12.3%.
Unemployment Correlation Summary
| Measurement | Immigrants from Eastern Europe | English |
| Minimum | 2.5% | 2.3% |
| Maximum | 9.7% | 76.9% |
| Range | 7.2% | 74.6% |
| Mean | 5.2% | 10.6% |
| Median | 5.0% | 4.9% |
| Interquartile 25% (IQ1) | 4.7% | 4.0% |
| Interquartile 75% (IQ3) | 5.6% | 9.0% |
| Interquartile Range (IQR) | 0.84% | 5.0% |
| Standard Deviation (Sample) | 1.1% | 13.7% |
| Standard Deviation (Population) | 1.1% | 13.6% |
Similar Demographics by Unemployment
Demographics Similar to Immigrants from Eastern Europe by Unemployment
In terms of unemployment, the demographic groups most similar to Immigrants from Eastern Europe are Immigrants from Hong Kong (5.2%, a difference of 0.010%), Egyptian (5.2%, a difference of 0.010%), Immigrants from China (5.2%, a difference of 0.050%), Potawatomi (5.2%, a difference of 0.070%), and Syrian (5.2%, a difference of 0.21%).
| Demographics | Rating | Rank | Unemployment |
| Indonesians | 82.3 /100 | #144 | Excellent 5.1% |
| Immigrants | Norway | 81.8 /100 | #145 | Excellent 5.1% |
| Immigrants | Asia | 81.8 /100 | #146 | Excellent 5.1% |
| Indians (Asian) | 81.6 /100 | #147 | Excellent 5.1% |
| Immigrants | Italy | 79.1 /100 | #148 | Good 5.1% |
| Syrians | 77.7 /100 | #149 | Good 5.2% |
| Potawatomi | 76.2 /100 | #150 | Good 5.2% |
| Immigrants | Eastern Europe | 75.3 /100 | #151 | Good 5.2% |
| Immigrants | Hong Kong | 75.2 /100 | #152 | Good 5.2% |
| Egyptians | 75.2 /100 | #153 | Good 5.2% |
| Immigrants | China | 74.7 /100 | #154 | Good 5.2% |
| Immigrants | Northern Africa | 71.3 /100 | #155 | Good 5.2% |
| Immigrants | Kazakhstan | 70.4 /100 | #156 | Good 5.2% |
| Sri Lankans | 69.5 /100 | #157 | Good 5.2% |
| Immigrants | Egypt | 66.7 /100 | #158 | Good 5.2% |
Demographics Similar to English by Unemployment
In terms of unemployment, the demographic groups most similar to English are Pennsylvania German (4.6%, a difference of 0.10%), Belgian (4.6%, a difference of 0.26%), Immigrants from Cuba (4.6%, a difference of 0.50%), Dutch (4.6%, a difference of 0.66%), and European (4.6%, a difference of 0.98%).
| Demographics | Rating | Rank | Unemployment |
| Danes | 100.0 /100 | #4 | Exceptional 4.3% |
| Swedes | 100.0 /100 | #5 | Exceptional 4.4% |
| Germans | 100.0 /100 | #6 | Exceptional 4.5% |
| Immigrants | India | 100.0 /100 | #7 | Exceptional 4.5% |
| Swiss | 100.0 /100 | #8 | Exceptional 4.5% |
| Scandinavians | 100.0 /100 | #9 | Exceptional 4.5% |
| Dutch | 100.0 /100 | #10 | Exceptional 4.6% |
| English | 100.0 /100 | #11 | Exceptional 4.6% |
| Pennsylvania Germans | 100.0 /100 | #12 | Exceptional 4.6% |
| Belgians | 100.0 /100 | #13 | Exceptional 4.6% |
| Immigrants | Cuba | 100.0 /100 | #14 | Exceptional 4.6% |
| Europeans | 99.9 /100 | #15 | Exceptional 4.6% |
| Chinese | 99.9 /100 | #16 | Exceptional 4.7% |
| Slovenes | 99.9 /100 | #17 | Exceptional 4.7% |
| Immigrants | Venezuela | 99.9 /100 | #18 | Exceptional 4.7% |