Immigrants from Eastern Europe vs Immigrants from Grenada Child Poverty Under the Age of 16
COMPARE
Immigrants from Eastern Europe
Immigrants from Grenada
Child Poverty Under the Age of 16
Child Poverty Under the Age of 16 Comparison
Immigrants from Eastern Europe
Immigrants from Grenada
14.4%
CHILD POVERTY UNDER THE AGE OF 16
97.5/ 100
METRIC RATING
76th/ 347
METRIC RANK
21.0%
CHILD POVERTY UNDER THE AGE OF 16
0.0/ 100
METRIC RATING
301st/ 347
METRIC RANK
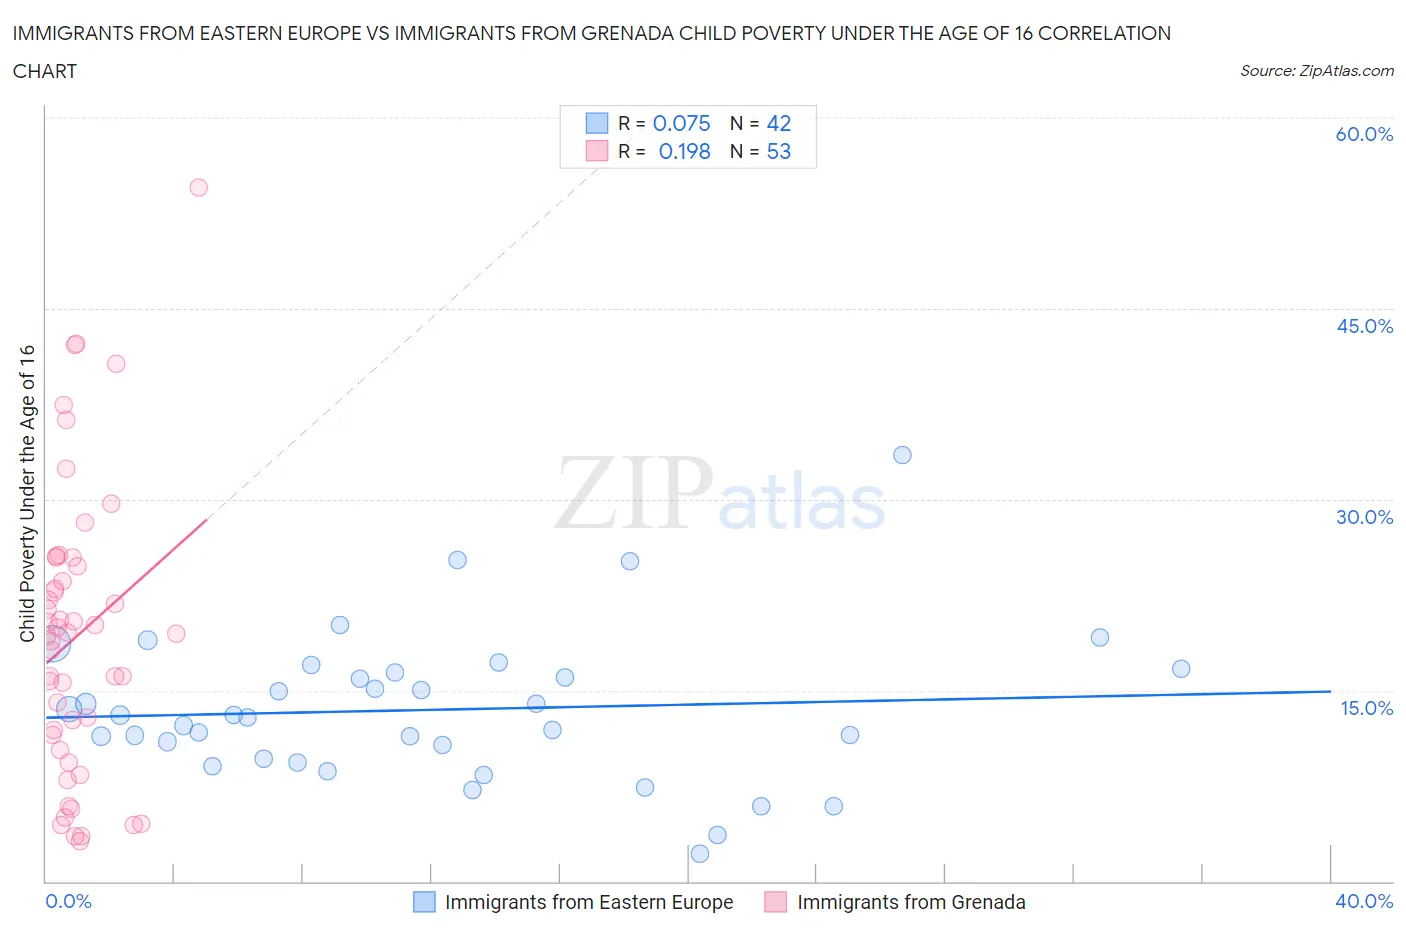
Immigrants from Eastern Europe vs Immigrants from Grenada Child Poverty Under the Age of 16 Correlation Chart
The statistical analysis conducted on geographies consisting of 468,643,389 people shows a slight positive correlation between the proportion of Immigrants from Eastern Europe and poverty level among children under the age of 16 in the United States with a correlation coefficient (R) of 0.075 and weighted average of 14.4%. Similarly, the statistical analysis conducted on geographies consisting of 67,065,416 people shows a poor positive correlation between the proportion of Immigrants from Grenada and poverty level among children under the age of 16 in the United States with a correlation coefficient (R) of 0.198 and weighted average of 21.0%, a difference of 45.3%.
Child Poverty Under the Age of 16 Correlation Summary
| Measurement | Immigrants from Eastern Europe | Immigrants from Grenada |
| Minimum | 2.1% | 3.1% |
| Maximum | 33.5% | 54.5% |
| Range | 31.3% | 51.4% |
| Mean | 13.5% | 19.2% |
| Median | 13.0% | 19.4% |
| Interquartile 25% (IQ1) | 9.6% | 10.9% |
| Interquartile 75% (IQ3) | 16.4% | 25.1% |
| Interquartile Range (IQR) | 6.8% | 14.2% |
| Standard Deviation (Sample) | 5.9% | 11.3% |
| Standard Deviation (Population) | 5.8% | 11.2% |
Similar Demographics by Child Poverty Under the Age of 16
Demographics Similar to Immigrants from Eastern Europe by Child Poverty Under the Age of 16
In terms of child poverty under the age of 16, the demographic groups most similar to Immigrants from Eastern Europe are Ukrainian (14.4%, a difference of 0.0%), Australian (14.4%, a difference of 0.030%), Immigrants from Turkey (14.4%, a difference of 0.21%), Macedonian (14.4%, a difference of 0.21%), and Immigrants from Russia (14.5%, a difference of 0.23%).
| Demographics | Rating | Rank | Child Poverty Under the Age of 16 |
| Immigrants | Bulgaria | 98.0 /100 | #69 | Exceptional 14.3% |
| Immigrants | Netherlands | 97.9 /100 | #70 | Exceptional 14.3% |
| Immigrants | Poland | 97.9 /100 | #71 | Exceptional 14.3% |
| Cambodians | 97.8 /100 | #72 | Exceptional 14.4% |
| Immigrants | Turkey | 97.6 /100 | #73 | Exceptional 14.4% |
| Macedonians | 97.6 /100 | #74 | Exceptional 14.4% |
| Ukrainians | 97.5 /100 | #75 | Exceptional 14.4% |
| Immigrants | Eastern Europe | 97.5 /100 | #76 | Exceptional 14.4% |
| Australians | 97.5 /100 | #77 | Exceptional 14.4% |
| Immigrants | Russia | 97.3 /100 | #78 | Exceptional 14.5% |
| Swiss | 97.3 /100 | #79 | Exceptional 14.5% |
| Immigrants | North Macedonia | 97.2 /100 | #80 | Exceptional 14.5% |
| Finns | 97.2 /100 | #81 | Exceptional 14.5% |
| Immigrants | Canada | 97.2 /100 | #82 | Exceptional 14.5% |
| Egyptians | 97.2 /100 | #83 | Exceptional 14.5% |
Demographics Similar to Immigrants from Grenada by Child Poverty Under the Age of 16
In terms of child poverty under the age of 16, the demographic groups most similar to Immigrants from Grenada are Indonesian (21.0%, a difference of 0.040%), Immigrants from Bahamas (21.0%, a difference of 0.24%), Choctaw (21.0%, a difference of 0.28%), Somali (21.0%, a difference of 0.33%), and Immigrants from Haiti (20.9%, a difference of 0.54%).
| Demographics | Rating | Rank | Child Poverty Under the Age of 16 |
| Haitians | 0.0 /100 | #294 | Tragic 20.7% |
| Mexicans | 0.0 /100 | #295 | Tragic 20.7% |
| Immigrants | Caribbean | 0.0 /100 | #296 | Tragic 20.8% |
| Hispanics or Latinos | 0.0 /100 | #297 | Tragic 20.8% |
| Arapaho | 0.0 /100 | #298 | Tragic 20.8% |
| Immigrants | Haiti | 0.0 /100 | #299 | Tragic 20.9% |
| Indonesians | 0.0 /100 | #300 | Tragic 21.0% |
| Immigrants | Grenada | 0.0 /100 | #301 | Tragic 21.0% |
| Immigrants | Bahamas | 0.0 /100 | #302 | Tragic 21.0% |
| Choctaw | 0.0 /100 | #303 | Tragic 21.0% |
| Somalis | 0.0 /100 | #304 | Tragic 21.0% |
| Seminole | 0.0 /100 | #305 | Tragic 21.1% |
| Guatemalans | 0.0 /100 | #306 | Tragic 21.2% |
| Immigrants | Central America | 0.0 /100 | #307 | Tragic 21.3% |
| British West Indians | 0.0 /100 | #308 | Tragic 21.3% |