Immigrants from Dominican Republic vs Central American Indian Female Unemployment
COMPARE
Immigrants from Dominican Republic
Central American Indian
Female Unemployment
Female Unemployment Comparison
Immigrants from Dominican Republic
Central American Indians
7.2%
FEMALE UNEMPLOYMENT
0.0/ 100
METRIC RATING
336th/ 347
METRIC RANK
6.3%
FEMALE UNEMPLOYMENT
0.0/ 100
METRIC RATING
310th/ 347
METRIC RANK
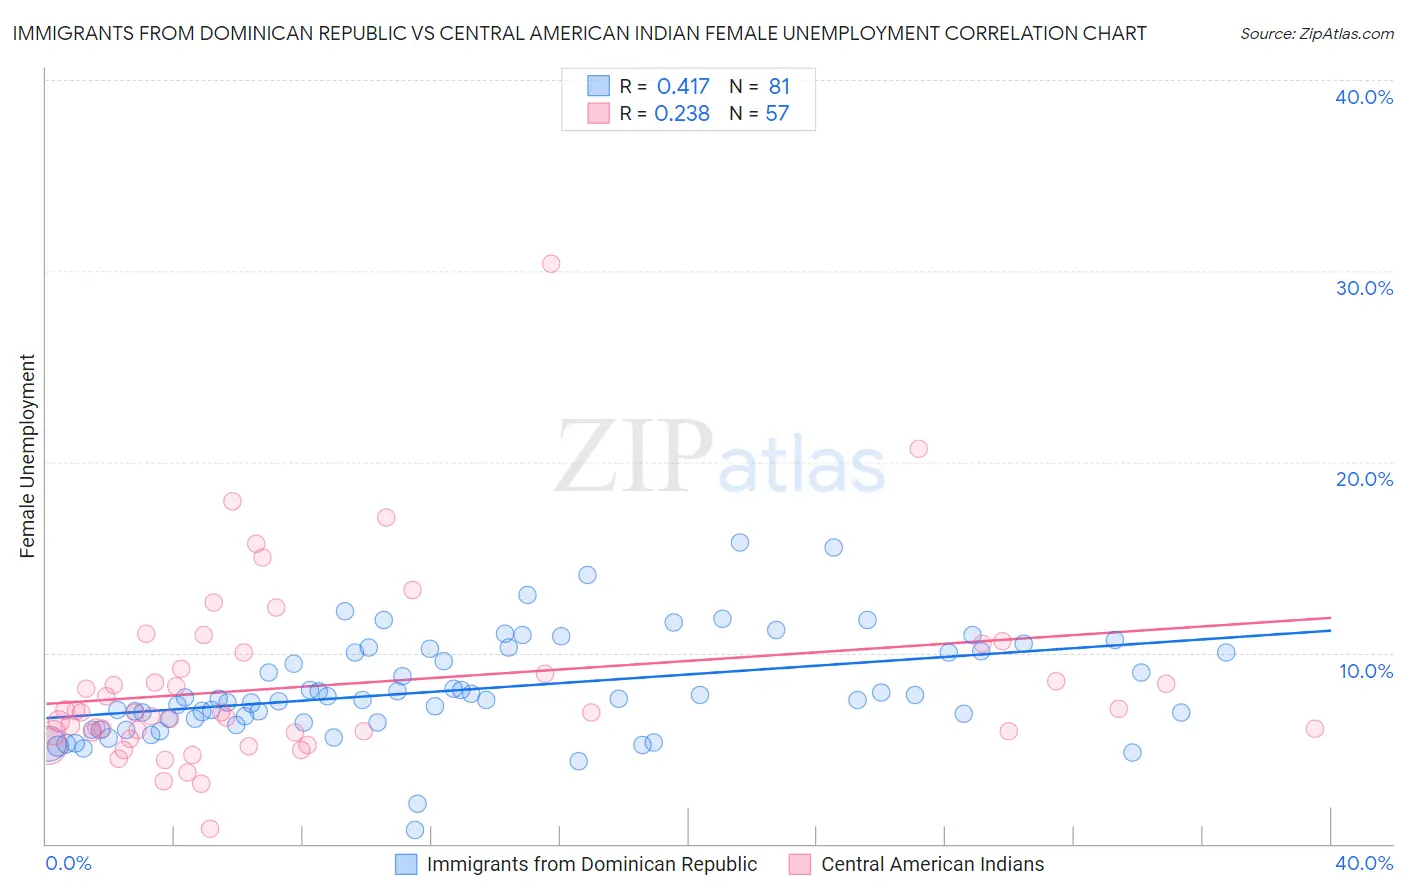
Immigrants from Dominican Republic vs Central American Indian Female Unemployment Correlation Chart
The statistical analysis conducted on geographies consisting of 274,282,461 people shows a moderate positive correlation between the proportion of Immigrants from Dominican Republic and unemploymnet rate among females in the United States with a correlation coefficient (R) of 0.417 and weighted average of 7.2%. Similarly, the statistical analysis conducted on geographies consisting of 325,404,232 people shows a weak positive correlation between the proportion of Central American Indians and unemploymnet rate among females in the United States with a correlation coefficient (R) of 0.238 and weighted average of 6.3%, a difference of 14.7%.
Female Unemployment Correlation Summary
| Measurement | Immigrants from Dominican Republic | Central American Indian |
| Minimum | 0.70% | 0.80% |
| Maximum | 15.8% | 30.4% |
| Range | 15.1% | 29.6% |
| Mean | 8.1% | 8.3% |
| Median | 7.6% | 6.9% |
| Interquartile 25% (IQ1) | 6.4% | 5.8% |
| Interquartile 75% (IQ3) | 10.1% | 9.6% |
| Interquartile Range (IQR) | 3.7% | 3.8% |
| Standard Deviation (Sample) | 2.7% | 4.8% |
| Standard Deviation (Population) | 2.7% | 4.8% |
Similar Demographics by Female Unemployment
Demographics Similar to Immigrants from Dominican Republic by Female Unemployment
In terms of female unemployment, the demographic groups most similar to Immigrants from Dominican Republic are Dominican (7.2%, a difference of 0.64%), Navajo (7.3%, a difference of 0.94%), Immigrants from Armenia (7.1%, a difference of 2.1%), Menominee (7.0%, a difference of 2.5%), and Sioux (7.0%, a difference of 2.5%).
| Demographics | Rating | Rank | Female Unemployment |
| Immigrants | Guyana | 0.0 /100 | #329 | Tragic 6.7% |
| Yakama | 0.0 /100 | #330 | Tragic 6.7% |
| Paiute | 0.0 /100 | #331 | Tragic 6.8% |
| Sioux | 0.0 /100 | #332 | Tragic 7.0% |
| Menominee | 0.0 /100 | #333 | Tragic 7.0% |
| Immigrants | Armenia | 0.0 /100 | #334 | Tragic 7.1% |
| Dominicans | 0.0 /100 | #335 | Tragic 7.2% |
| Immigrants | Dominican Republic | 0.0 /100 | #336 | Tragic 7.2% |
| Navajo | 0.0 /100 | #337 | Tragic 7.3% |
| Tohono O'odham | 0.0 /100 | #338 | Tragic 7.7% |
| Immigrants | Yemen | 0.0 /100 | #339 | Tragic 7.8% |
| Hopi | 0.0 /100 | #340 | Tragic 8.1% |
| Inupiat | 0.0 /100 | #341 | Tragic 8.2% |
| Puerto Ricans | 0.0 /100 | #342 | Tragic 8.3% |
| Arapaho | 0.0 /100 | #343 | Tragic 8.8% |
Demographics Similar to Central American Indians by Female Unemployment
In terms of female unemployment, the demographic groups most similar to Central American Indians are Immigrants from Mexico (6.3%, a difference of 0.13%), Ecuadorian (6.3%, a difference of 0.41%), Immigrants from Grenada (6.3%, a difference of 0.79%), Belizean (6.3%, a difference of 0.81%), and Hispanic or Latino (6.2%, a difference of 0.99%).
| Demographics | Rating | Rank | Female Unemployment |
| Barbadians | 0.0 /100 | #303 | Tragic 6.2% |
| Immigrants | Jamaica | 0.0 /100 | #304 | Tragic 6.2% |
| Spanish American Indians | 0.0 /100 | #305 | Tragic 6.2% |
| Immigrants | Central America | 0.0 /100 | #306 | Tragic 6.2% |
| Shoshone | 0.0 /100 | #307 | Tragic 6.2% |
| Hispanics or Latinos | 0.0 /100 | #308 | Tragic 6.2% |
| Ecuadorians | 0.0 /100 | #309 | Tragic 6.3% |
| Central American Indians | 0.0 /100 | #310 | Tragic 6.3% |
| Immigrants | Mexico | 0.0 /100 | #311 | Tragic 6.3% |
| Immigrants | Grenada | 0.0 /100 | #312 | Tragic 6.3% |
| Belizeans | 0.0 /100 | #313 | Tragic 6.3% |
| Immigrants | Ecuador | 0.0 /100 | #314 | Tragic 6.4% |
| Pueblo | 0.0 /100 | #315 | Tragic 6.4% |
| Houma | 0.0 /100 | #316 | Tragic 6.4% |
| Immigrants | St. Vincent and the Grenadines | 0.0 /100 | #317 | Tragic 6.4% |