Immigrants from Dominican Republic vs Egyptian Female Unemployment
COMPARE
Immigrants from Dominican Republic
Egyptian
Female Unemployment
Female Unemployment Comparison
Immigrants from Dominican Republic
Egyptians
7.2%
FEMALE UNEMPLOYMENT
0.0/ 100
METRIC RATING
336th/ 347
METRIC RANK
5.2%
FEMALE UNEMPLOYMENT
78.3/ 100
METRIC RATING
150th/ 347
METRIC RANK
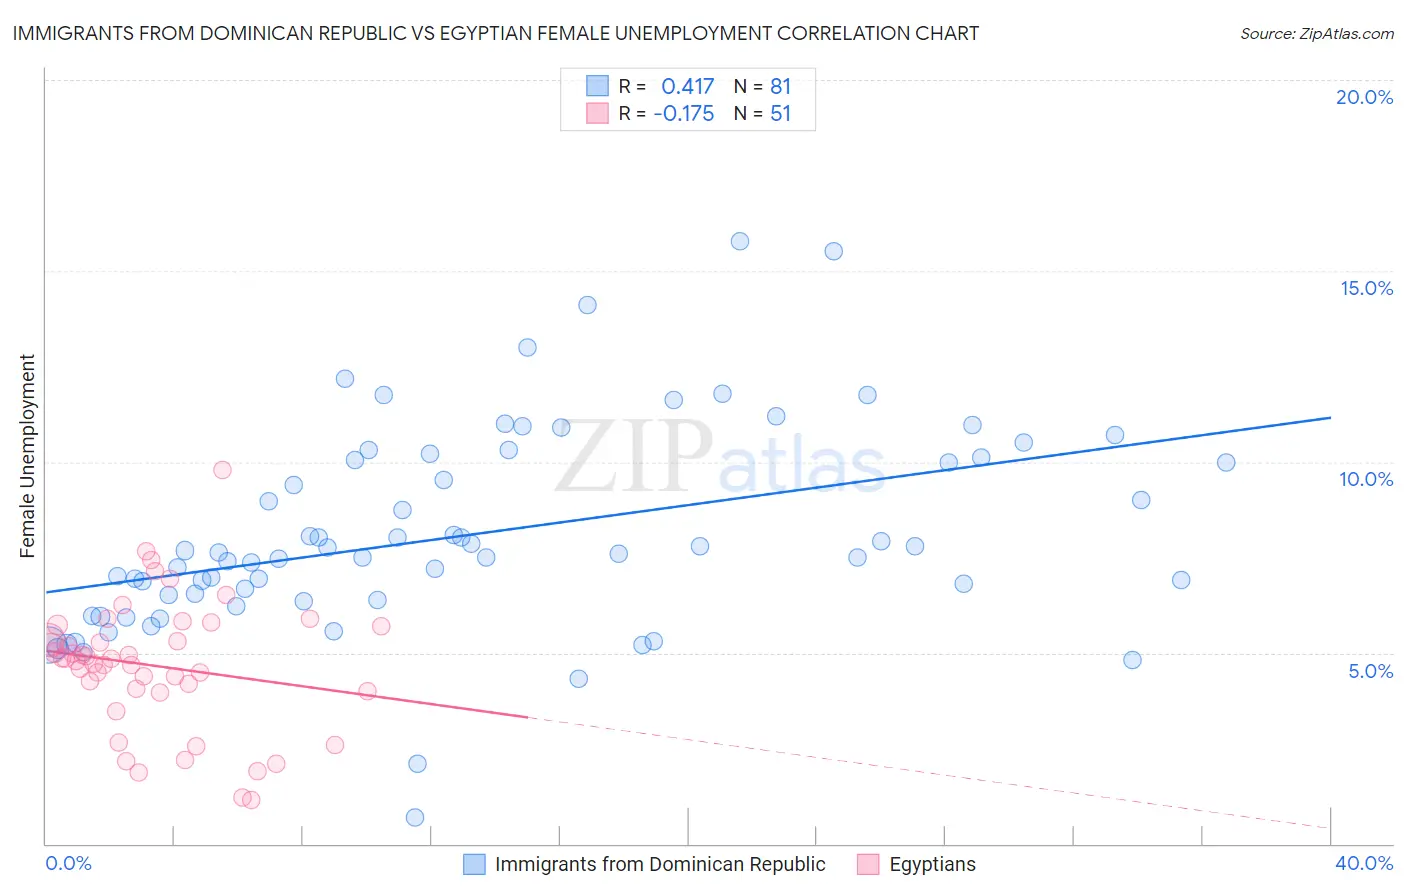
Immigrants from Dominican Republic vs Egyptian Female Unemployment Correlation Chart
The statistical analysis conducted on geographies consisting of 274,282,461 people shows a moderate positive correlation between the proportion of Immigrants from Dominican Republic and unemploymnet rate among females in the United States with a correlation coefficient (R) of 0.417 and weighted average of 7.2%. Similarly, the statistical analysis conducted on geographies consisting of 276,383,478 people shows a poor negative correlation between the proportion of Egyptians and unemploymnet rate among females in the United States with a correlation coefficient (R) of -0.175 and weighted average of 5.2%, a difference of 40.0%.
Female Unemployment Correlation Summary
| Measurement | Immigrants from Dominican Republic | Egyptian |
| Minimum | 0.70% | 1.2% |
| Maximum | 15.8% | 9.8% |
| Range | 15.1% | 8.6% |
| Mean | 8.1% | 4.7% |
| Median | 7.6% | 4.9% |
| Interquartile 25% (IQ1) | 6.4% | 4.0% |
| Interquartile 75% (IQ3) | 10.1% | 5.7% |
| Interquartile Range (IQR) | 3.7% | 1.7% |
| Standard Deviation (Sample) | 2.7% | 1.7% |
| Standard Deviation (Population) | 2.7% | 1.7% |
Similar Demographics by Female Unemployment
Demographics Similar to Immigrants from Dominican Republic by Female Unemployment
In terms of female unemployment, the demographic groups most similar to Immigrants from Dominican Republic are Dominican (7.2%, a difference of 0.64%), Navajo (7.3%, a difference of 0.94%), Immigrants from Armenia (7.1%, a difference of 2.1%), Menominee (7.0%, a difference of 2.5%), and Sioux (7.0%, a difference of 2.5%).
| Demographics | Rating | Rank | Female Unemployment |
| Immigrants | Guyana | 0.0 /100 | #329 | Tragic 6.7% |
| Yakama | 0.0 /100 | #330 | Tragic 6.7% |
| Paiute | 0.0 /100 | #331 | Tragic 6.8% |
| Sioux | 0.0 /100 | #332 | Tragic 7.0% |
| Menominee | 0.0 /100 | #333 | Tragic 7.0% |
| Immigrants | Armenia | 0.0 /100 | #334 | Tragic 7.1% |
| Dominicans | 0.0 /100 | #335 | Tragic 7.2% |
| Immigrants | Dominican Republic | 0.0 /100 | #336 | Tragic 7.2% |
| Navajo | 0.0 /100 | #337 | Tragic 7.3% |
| Tohono O'odham | 0.0 /100 | #338 | Tragic 7.7% |
| Immigrants | Yemen | 0.0 /100 | #339 | Tragic 7.8% |
| Hopi | 0.0 /100 | #340 | Tragic 8.1% |
| Inupiat | 0.0 /100 | #341 | Tragic 8.2% |
| Puerto Ricans | 0.0 /100 | #342 | Tragic 8.3% |
| Arapaho | 0.0 /100 | #343 | Tragic 8.8% |
Demographics Similar to Egyptians by Female Unemployment
In terms of female unemployment, the demographic groups most similar to Egyptians are Asian (5.2%, a difference of 0.010%), Immigrants from Argentina (5.2%, a difference of 0.040%), Argentinean (5.2%, a difference of 0.080%), Immigrants from Norway (5.2%, a difference of 0.10%), and Immigrants from Oceania (5.2%, a difference of 0.11%).
| Demographics | Rating | Rank | Female Unemployment |
| Immigrants | Kazakhstan | 80.7 /100 | #143 | Excellent 5.1% |
| Immigrants | Jordan | 80.4 /100 | #144 | Excellent 5.1% |
| Immigrants | Oceania | 79.5 /100 | #145 | Good 5.2% |
| Immigrants | Norway | 79.4 /100 | #146 | Good 5.2% |
| Argentineans | 79.2 /100 | #147 | Good 5.2% |
| Immigrants | Argentina | 78.7 /100 | #148 | Good 5.2% |
| Asians | 78.3 /100 | #149 | Good 5.2% |
| Egyptians | 78.3 /100 | #150 | Good 5.2% |
| Immigrants | China | 75.9 /100 | #151 | Good 5.2% |
| Immigrants | Italy | 75.0 /100 | #152 | Good 5.2% |
| Immigrants | Greece | 74.9 /100 | #153 | Good 5.2% |
| South Africans | 70.8 /100 | #154 | Good 5.2% |
| Immigrants | Egypt | 70.0 /100 | #155 | Good 5.2% |
| Immigrants | Northern Africa | 69.6 /100 | #156 | Good 5.2% |
| Immigrants | Russia | 69.3 /100 | #157 | Good 5.2% |