Immigrants from Dominica vs Central American Indian Female Unemployment
COMPARE
Immigrants from Dominica
Central American Indian
Female Unemployment
Female Unemployment Comparison
Immigrants from Dominica
Central American Indians
6.5%
FEMALE UNEMPLOYMENT
0.0/ 100
METRIC RATING
320th/ 347
METRIC RANK
6.3%
FEMALE UNEMPLOYMENT
0.0/ 100
METRIC RATING
310th/ 347
METRIC RANK
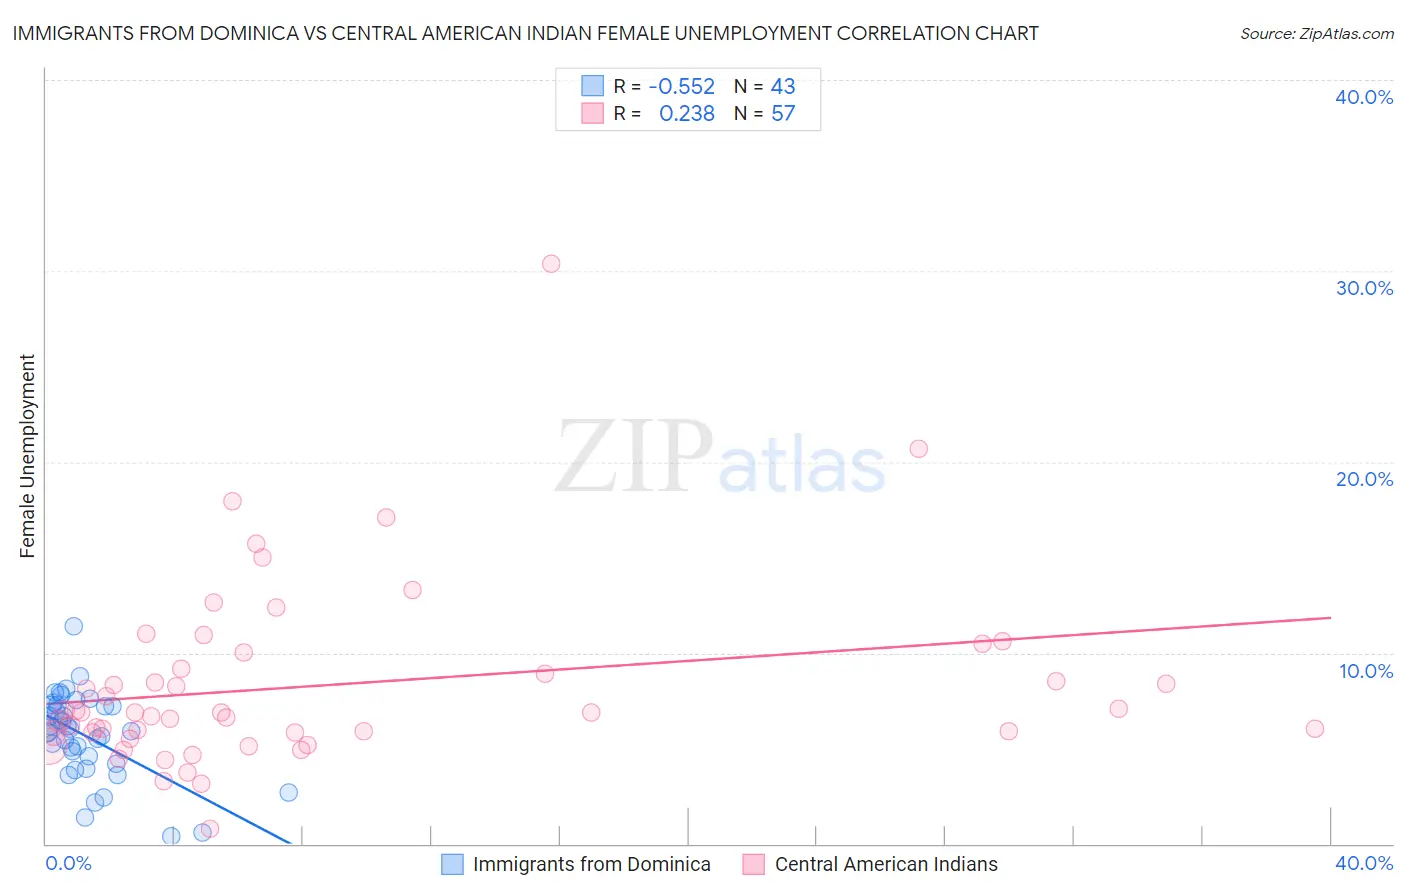
Immigrants from Dominica vs Central American Indian Female Unemployment Correlation Chart
The statistical analysis conducted on geographies consisting of 83,755,488 people shows a substantial negative correlation between the proportion of Immigrants from Dominica and unemploymnet rate among females in the United States with a correlation coefficient (R) of -0.552 and weighted average of 6.5%. Similarly, the statistical analysis conducted on geographies consisting of 325,404,232 people shows a weak positive correlation between the proportion of Central American Indians and unemploymnet rate among females in the United States with a correlation coefficient (R) of 0.238 and weighted average of 6.3%, a difference of 2.6%.
Female Unemployment Correlation Summary
| Measurement | Immigrants from Dominica | Central American Indian |
| Minimum | 0.40% | 0.80% |
| Maximum | 11.4% | 30.4% |
| Range | 11.0% | 29.6% |
| Mean | 5.6% | 8.3% |
| Median | 5.9% | 6.9% |
| Interquartile 25% (IQ1) | 4.2% | 5.8% |
| Interquartile 75% (IQ3) | 7.3% | 9.6% |
| Interquartile Range (IQR) | 3.1% | 3.8% |
| Standard Deviation (Sample) | 2.2% | 4.8% |
| Standard Deviation (Population) | 2.2% | 4.8% |
Demographics Similar to Immigrants from Dominica and Central American Indians by Female Unemployment
In terms of female unemployment, the demographic groups most similar to Immigrants from Dominica are Immigrants from Bangladesh (6.5%, a difference of 0.010%), British West Indian (6.4%, a difference of 0.20%), Immigrants from St. Vincent and the Grenadines (6.4%, a difference of 0.48%), Black/African American (6.5%, a difference of 0.54%), and Vietnamese (6.5%, a difference of 0.62%). Similarly, the demographic groups most similar to Central American Indians are Immigrants from Mexico (6.3%, a difference of 0.13%), Ecuadorian (6.3%, a difference of 0.41%), Immigrants from Grenada (6.3%, a difference of 0.79%), Belizean (6.3%, a difference of 0.81%), and Hispanic or Latino (6.2%, a difference of 0.99%).
| Demographics | Rating | Rank | Female Unemployment |
| Spanish American Indians | 0.0 /100 | #305 | Tragic 6.2% |
| Immigrants | Central America | 0.0 /100 | #306 | Tragic 6.2% |
| Shoshone | 0.0 /100 | #307 | Tragic 6.2% |
| Hispanics or Latinos | 0.0 /100 | #308 | Tragic 6.2% |
| Ecuadorians | 0.0 /100 | #309 | Tragic 6.3% |
| Central American Indians | 0.0 /100 | #310 | Tragic 6.3% |
| Immigrants | Mexico | 0.0 /100 | #311 | Tragic 6.3% |
| Immigrants | Grenada | 0.0 /100 | #312 | Tragic 6.3% |
| Belizeans | 0.0 /100 | #313 | Tragic 6.3% |
| Immigrants | Ecuador | 0.0 /100 | #314 | Tragic 6.4% |
| Pueblo | 0.0 /100 | #315 | Tragic 6.4% |
| Houma | 0.0 /100 | #316 | Tragic 6.4% |
| Immigrants | St. Vincent and the Grenadines | 0.0 /100 | #317 | Tragic 6.4% |
| British West Indians | 0.0 /100 | #318 | Tragic 6.4% |
| Immigrants | Bangladesh | 0.0 /100 | #319 | Tragic 6.5% |
| Immigrants | Dominica | 0.0 /100 | #320 | Tragic 6.5% |
| Blacks/African Americans | 0.0 /100 | #321 | Tragic 6.5% |
| Vietnamese | 0.0 /100 | #322 | Tragic 6.5% |
| Immigrants | Belize | 0.0 /100 | #323 | Tragic 6.5% |
| Cheyenne | 0.0 /100 | #324 | Tragic 6.6% |
| Apache | 0.0 /100 | #325 | Tragic 6.6% |