Immigrants from Dominican Republic vs Potawatomi Female Unemployment
COMPARE
Immigrants from Dominican Republic
Potawatomi
Female Unemployment
Female Unemployment Comparison
Immigrants from Dominican Republic
Potawatomi
7.2%
FEMALE UNEMPLOYMENT
0.0/ 100
METRIC RATING
336th/ 347
METRIC RANK
5.2%
FEMALE UNEMPLOYMENT
65.9/ 100
METRIC RATING
162nd/ 347
METRIC RANK
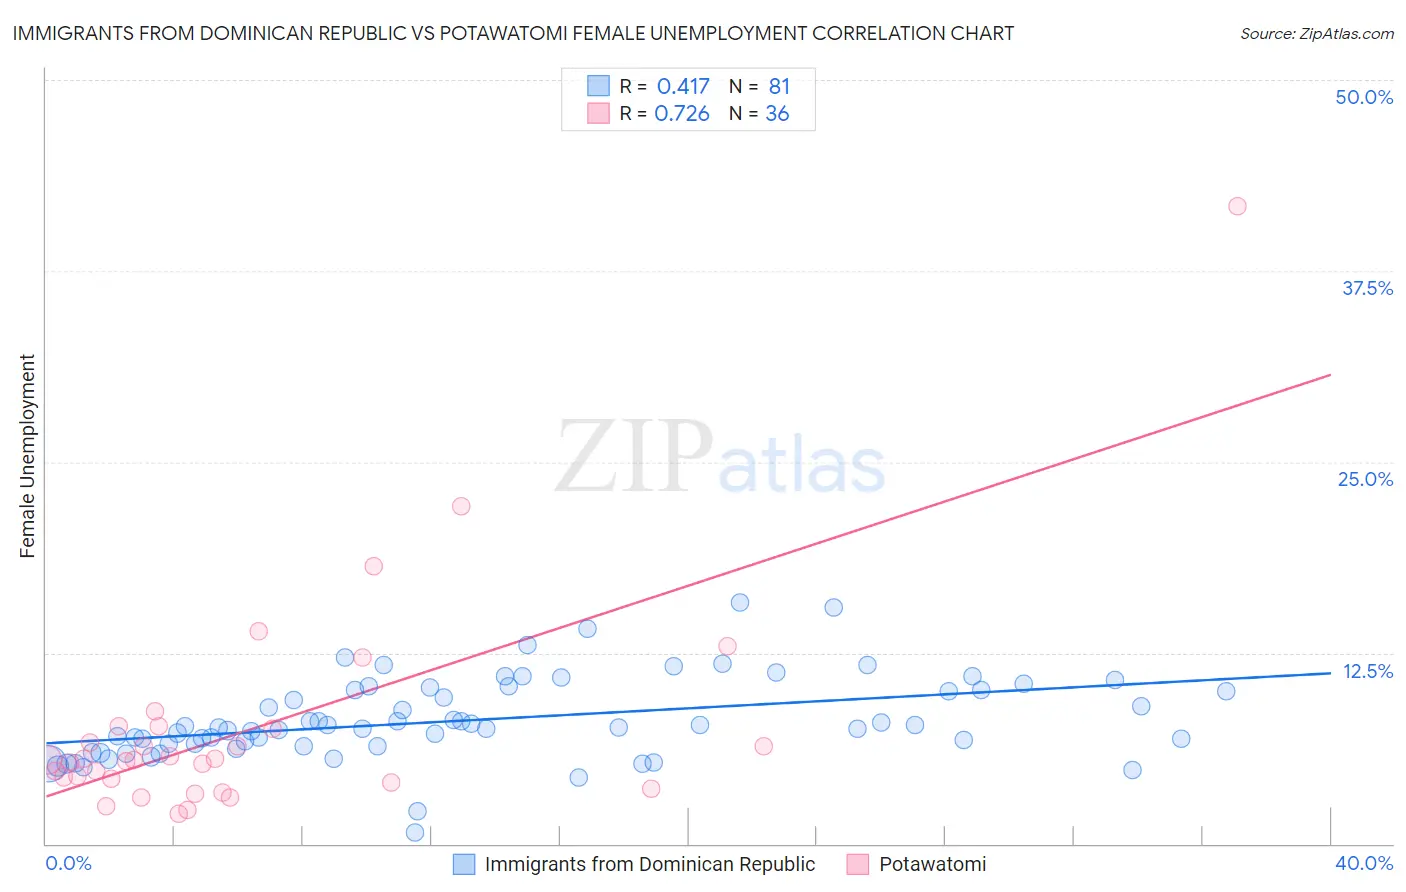
Immigrants from Dominican Republic vs Potawatomi Female Unemployment Correlation Chart
The statistical analysis conducted on geographies consisting of 274,282,461 people shows a moderate positive correlation between the proportion of Immigrants from Dominican Republic and unemploymnet rate among females in the United States with a correlation coefficient (R) of 0.417 and weighted average of 7.2%. Similarly, the statistical analysis conducted on geographies consisting of 117,345,234 people shows a strong positive correlation between the proportion of Potawatomi and unemploymnet rate among females in the United States with a correlation coefficient (R) of 0.726 and weighted average of 5.2%, a difference of 38.7%.
Female Unemployment Correlation Summary
| Measurement | Immigrants from Dominican Republic | Potawatomi |
| Minimum | 0.70% | 2.0% |
| Maximum | 15.8% | 41.7% |
| Range | 15.1% | 39.7% |
| Mean | 8.1% | 7.5% |
| Median | 7.6% | 5.5% |
| Interquartile 25% (IQ1) | 6.4% | 4.1% |
| Interquartile 75% (IQ3) | 10.1% | 7.6% |
| Interquartile Range (IQR) | 3.7% | 3.5% |
| Standard Deviation (Sample) | 2.7% | 7.3% |
| Standard Deviation (Population) | 2.7% | 7.2% |
Similar Demographics by Female Unemployment
Demographics Similar to Immigrants from Dominican Republic by Female Unemployment
In terms of female unemployment, the demographic groups most similar to Immigrants from Dominican Republic are Dominican (7.2%, a difference of 0.64%), Navajo (7.3%, a difference of 0.94%), Immigrants from Armenia (7.1%, a difference of 2.1%), Menominee (7.0%, a difference of 2.5%), and Sioux (7.0%, a difference of 2.5%).
| Demographics | Rating | Rank | Female Unemployment |
| Immigrants | Guyana | 0.0 /100 | #329 | Tragic 6.7% |
| Yakama | 0.0 /100 | #330 | Tragic 6.7% |
| Paiute | 0.0 /100 | #331 | Tragic 6.8% |
| Sioux | 0.0 /100 | #332 | Tragic 7.0% |
| Menominee | 0.0 /100 | #333 | Tragic 7.0% |
| Immigrants | Armenia | 0.0 /100 | #334 | Tragic 7.1% |
| Dominicans | 0.0 /100 | #335 | Tragic 7.2% |
| Immigrants | Dominican Republic | 0.0 /100 | #336 | Tragic 7.2% |
| Navajo | 0.0 /100 | #337 | Tragic 7.3% |
| Tohono O'odham | 0.0 /100 | #338 | Tragic 7.7% |
| Immigrants | Yemen | 0.0 /100 | #339 | Tragic 7.8% |
| Hopi | 0.0 /100 | #340 | Tragic 8.1% |
| Inupiat | 0.0 /100 | #341 | Tragic 8.2% |
| Puerto Ricans | 0.0 /100 | #342 | Tragic 8.3% |
| Arapaho | 0.0 /100 | #343 | Tragic 8.8% |
Demographics Similar to Potawatomi by Female Unemployment
In terms of female unemployment, the demographic groups most similar to Potawatomi are Immigrants from Pakistan (5.2%, a difference of 0.050%), Immigrants from Spain (5.2%, a difference of 0.060%), Immigrants from Micronesia (5.2%, a difference of 0.070%), Immigrants from Asia (5.2%, a difference of 0.11%), and Bangladeshi (5.2%, a difference of 0.11%).
| Demographics | Rating | Rank | Female Unemployment |
| Immigrants | Egypt | 70.0 /100 | #155 | Good 5.2% |
| Immigrants | Northern Africa | 69.6 /100 | #156 | Good 5.2% |
| Immigrants | Russia | 69.3 /100 | #157 | Good 5.2% |
| Albanians | 68.3 /100 | #158 | Good 5.2% |
| Immigrants | Micronesia | 66.9 /100 | #159 | Good 5.2% |
| Immigrants | Spain | 66.8 /100 | #160 | Good 5.2% |
| Immigrants | Pakistan | 66.7 /100 | #161 | Good 5.2% |
| Potawatomi | 65.9 /100 | #162 | Good 5.2% |
| Immigrants | Asia | 64.3 /100 | #163 | Good 5.2% |
| Bangladeshis | 64.3 /100 | #164 | Good 5.2% |
| Syrians | 62.8 /100 | #165 | Good 5.2% |
| Native Hawaiians | 62.7 /100 | #166 | Good 5.2% |
| Immigrants | Thailand | 62.1 /100 | #167 | Good 5.2% |
| Sri Lankans | 59.4 /100 | #168 | Average 5.2% |
| Immigrants | Chile | 59.0 /100 | #169 | Average 5.2% |