Immigrants from Czechoslovakia vs Immigrants from Barbados Unemployment
COMPARE
Immigrants from Czechoslovakia
Immigrants from Barbados
Unemployment
Unemployment Comparison
Immigrants from Czechoslovakia
Immigrants from Barbados
5.0%
UNEMPLOYMENT
95.1/ 100
METRIC RATING
97th/ 347
METRIC RANK
6.6%
UNEMPLOYMENT
0.0/ 100
METRIC RATING
313th/ 347
METRIC RANK
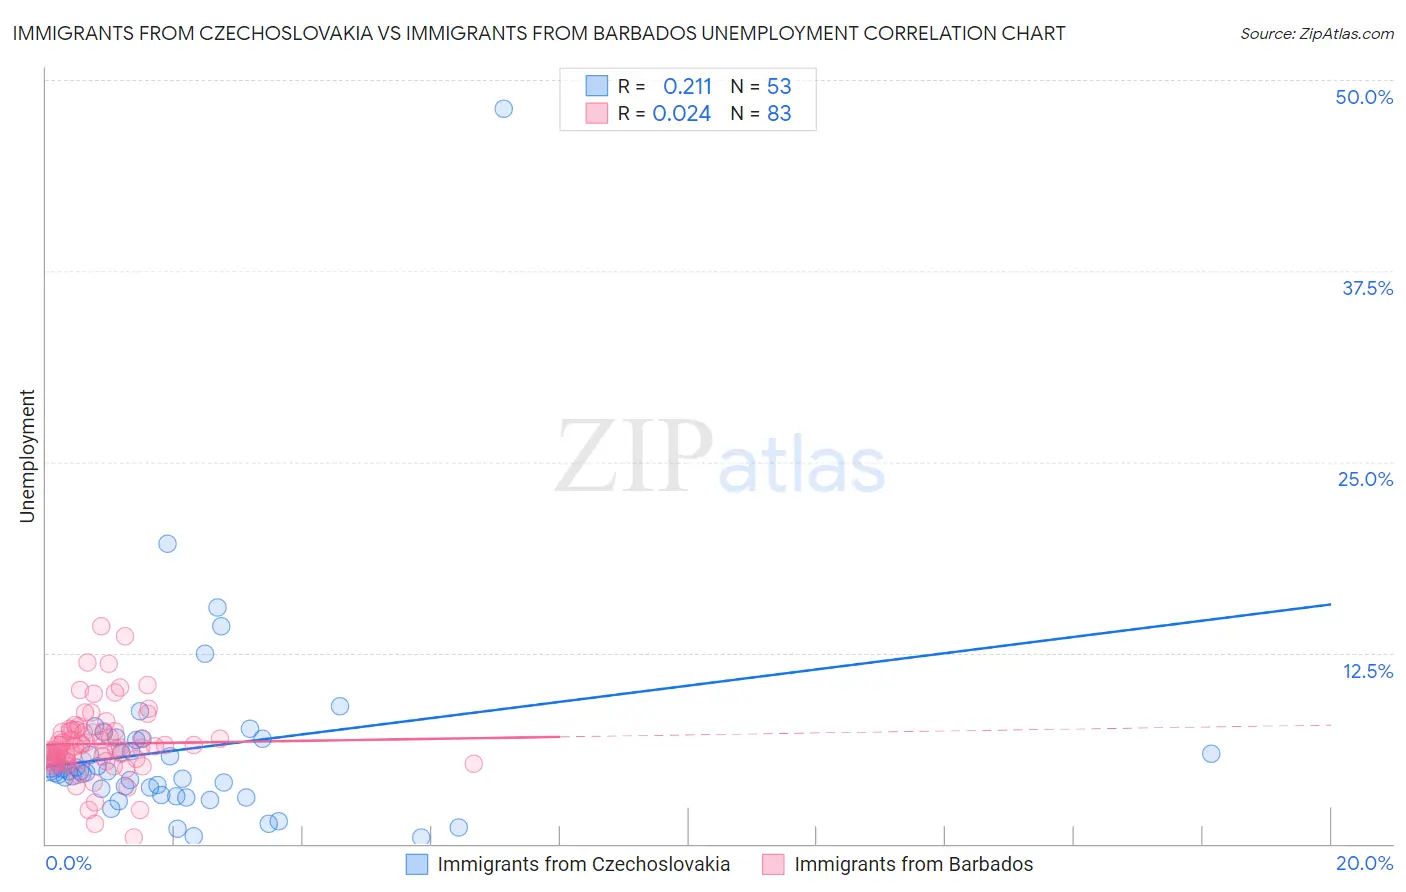
Immigrants from Czechoslovakia vs Immigrants from Barbados Unemployment Correlation Chart
The statistical analysis conducted on geographies consisting of 195,397,412 people shows a weak positive correlation between the proportion of Immigrants from Czechoslovakia and unemployment in the United States with a correlation coefficient (R) of 0.211 and weighted average of 5.0%. Similarly, the statistical analysis conducted on geographies consisting of 112,764,832 people shows no correlation between the proportion of Immigrants from Barbados and unemployment in the United States with a correlation coefficient (R) of 0.024 and weighted average of 6.6%, a difference of 31.4%.
Unemployment Correlation Summary
| Measurement | Immigrants from Czechoslovakia | Immigrants from Barbados |
| Minimum | 0.40% | 0.40% |
| Maximum | 48.1% | 14.2% |
| Range | 47.7% | 13.8% |
| Mean | 6.2% | 6.5% |
| Median | 4.7% | 6.3% |
| Interquartile 25% (IQ1) | 3.4% | 5.4% |
| Interquartile 75% (IQ3) | 6.9% | 7.4% |
| Interquartile Range (IQR) | 3.5% | 2.0% |
| Standard Deviation (Sample) | 6.9% | 2.3% |
| Standard Deviation (Population) | 6.8% | 2.3% |
Similar Demographics by Unemployment
Demographics Similar to Immigrants from Czechoslovakia by Unemployment
In terms of unemployment, the demographic groups most similar to Immigrants from Czechoslovakia are Immigrants from England (5.0%, a difference of 0.030%), Romanian (5.0%, a difference of 0.030%), Mongolian (5.0%, a difference of 0.10%), Estonian (5.0%, a difference of 0.16%), and Immigrants from Serbia (5.0%, a difference of 0.19%).
| Demographics | Rating | Rank | Unemployment |
| Immigrants | North Macedonia | 96.3 /100 | #90 | Exceptional 5.0% |
| Immigrants | Sudan | 96.3 /100 | #91 | Exceptional 5.0% |
| Immigrants | South Africa | 96.2 /100 | #92 | Exceptional 5.0% |
| Ukrainians | 96.0 /100 | #93 | Exceptional 5.0% |
| Immigrants | Austria | 95.9 /100 | #94 | Exceptional 5.0% |
| Immigrants | Serbia | 95.6 /100 | #95 | Exceptional 5.0% |
| Immigrants | England | 95.2 /100 | #96 | Exceptional 5.0% |
| Immigrants | Czechoslovakia | 95.1 /100 | #97 | Exceptional 5.0% |
| Romanians | 95.0 /100 | #98 | Exceptional 5.0% |
| Mongolians | 94.8 /100 | #99 | Exceptional 5.0% |
| Estonians | 94.6 /100 | #100 | Exceptional 5.0% |
| Americans | 94.3 /100 | #101 | Exceptional 5.0% |
| Immigrants | Argentina | 94.1 /100 | #102 | Exceptional 5.0% |
| Chickasaw | 94.0 /100 | #103 | Exceptional 5.0% |
| Osage | 94.0 /100 | #104 | Exceptional 5.0% |
Demographics Similar to Immigrants from Barbados by Unemployment
In terms of unemployment, the demographic groups most similar to Immigrants from Barbados are Colville (6.6%, a difference of 0.38%), Black/African American (6.6%, a difference of 0.55%), Cape Verdean (6.5%, a difference of 0.95%), Immigrants from Belize (6.5%, a difference of 1.3%), and Houma (6.7%, a difference of 1.3%).
| Demographics | Rating | Rank | Unemployment |
| Lumbee | 0.0 /100 | #306 | Tragic 6.4% |
| Immigrants | Bangladesh | 0.0 /100 | #307 | Tragic 6.5% |
| Barbadians | 0.0 /100 | #308 | Tragic 6.5% |
| Vietnamese | 0.0 /100 | #309 | Tragic 6.5% |
| Immigrants | Belize | 0.0 /100 | #310 | Tragic 6.5% |
| Cape Verdeans | 0.0 /100 | #311 | Tragic 6.5% |
| Colville | 0.0 /100 | #312 | Tragic 6.6% |
| Immigrants | Barbados | 0.0 /100 | #313 | Tragic 6.6% |
| Blacks/African Americans | 0.0 /100 | #314 | Tragic 6.6% |
| Houma | 0.0 /100 | #315 | Tragic 6.7% |
| Immigrants | Dominica | 0.0 /100 | #316 | Tragic 6.7% |
| Shoshone | 0.0 /100 | #317 | Tragic 6.8% |
| Immigrants | Cabo Verde | 0.0 /100 | #318 | Tragic 6.8% |
| British West Indians | 0.0 /100 | #319 | Tragic 6.8% |
| Immigrants | St. Vincent and the Grenadines | 0.0 /100 | #320 | Tragic 6.9% |