Immigrants from Czechoslovakia vs Immigrants from Bahamas Unemployment Among Ages 65 to 74 years
COMPARE
Immigrants from Czechoslovakia
Immigrants from Bahamas
Unemployment Among Ages 65 to 74 years
Unemployment Among Ages 65 to 74 years Comparison
Immigrants from Czechoslovakia
Immigrants from Bahamas
5.3%
UNEMPLOYMENT AMONG AGES 65 TO 74 YEARS
66.3/ 100
METRIC RATING
159th/ 347
METRIC RANK
5.9%
UNEMPLOYMENT AMONG AGES 65 TO 74 YEARS
0.0/ 100
METRIC RATING
320th/ 347
METRIC RANK
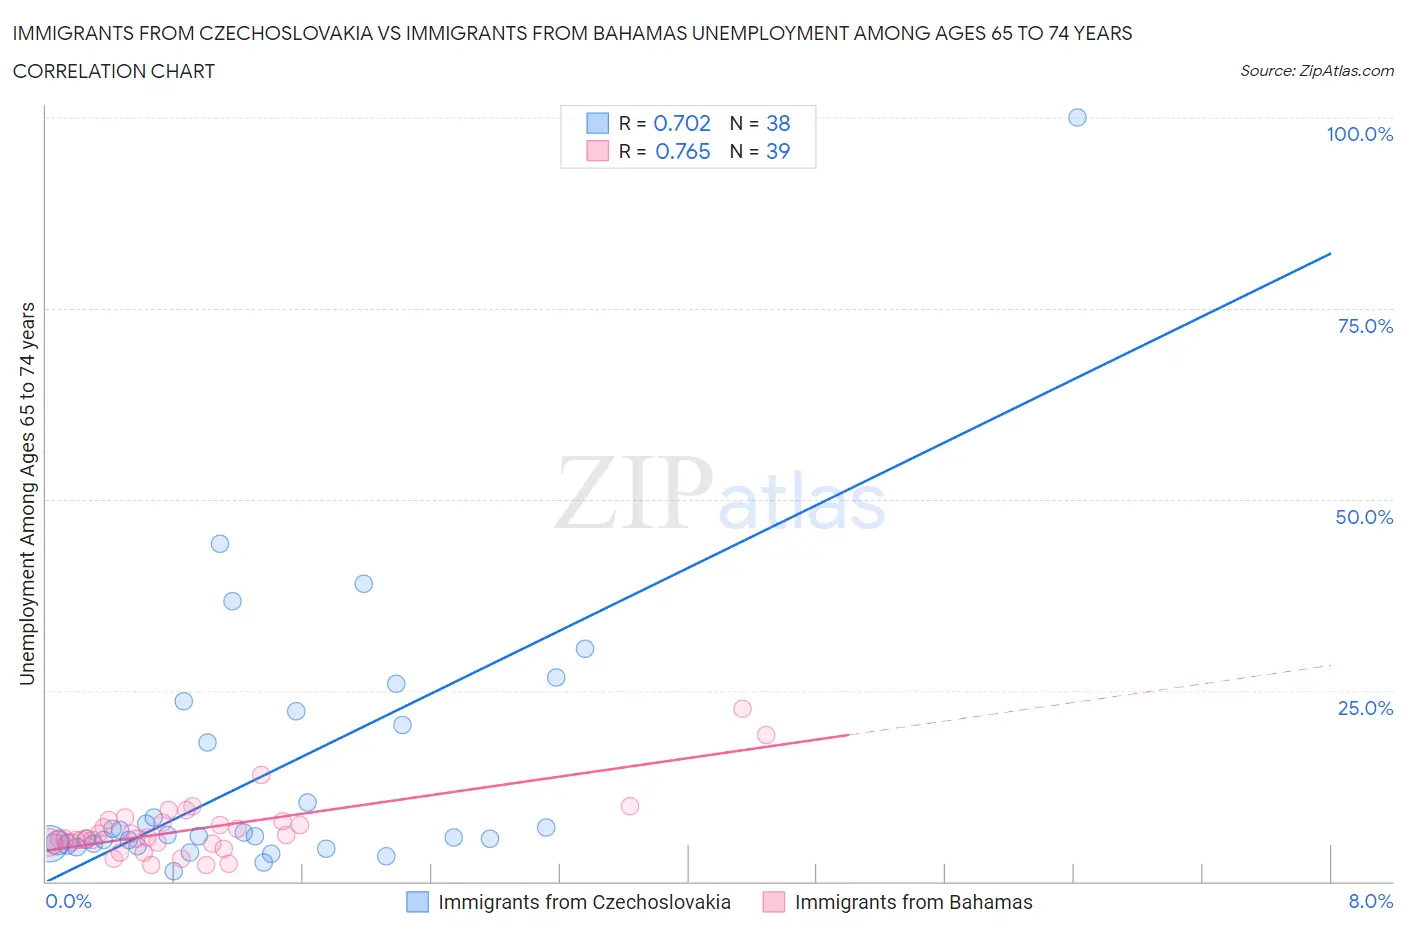
Immigrants from Czechoslovakia vs Immigrants from Bahamas Unemployment Among Ages 65 to 74 years Correlation Chart
The statistical analysis conducted on geographies consisting of 183,966,950 people shows a strong positive correlation between the proportion of Immigrants from Czechoslovakia and unemployment rate among population between the ages 65 and 74 in the United States with a correlation coefficient (R) of 0.702 and weighted average of 5.3%. Similarly, the statistical analysis conducted on geographies consisting of 99,659,659 people shows a strong positive correlation between the proportion of Immigrants from Bahamas and unemployment rate among population between the ages 65 and 74 in the United States with a correlation coefficient (R) of 0.765 and weighted average of 5.9%, a difference of 11.5%.
Unemployment Among Ages 65 to 74 years Correlation Summary
| Measurement | Immigrants from Czechoslovakia | Immigrants from Bahamas |
| Minimum | 1.2% | 2.2% |
| Maximum | 100.0% | 22.6% |
| Range | 98.8% | 20.4% |
| Mean | 14.0% | 6.8% |
| Median | 6.0% | 5.6% |
| Interquartile 25% (IQ1) | 4.9% | 5.0% |
| Interquartile 75% (IQ3) | 20.5% | 7.8% |
| Interquartile Range (IQR) | 15.6% | 2.8% |
| Standard Deviation (Sample) | 18.2% | 4.1% |
| Standard Deviation (Population) | 18.0% | 4.1% |
Similar Demographics by Unemployment Among Ages 65 to 74 years
Demographics Similar to Immigrants from Czechoslovakia by Unemployment Among Ages 65 to 74 years
In terms of unemployment among ages 65 to 74 years, the demographic groups most similar to Immigrants from Czechoslovakia are Bangladeshi (5.3%, a difference of 0.020%), Immigrants from Italy (5.3%, a difference of 0.10%), Immigrants from Eastern Asia (5.3%, a difference of 0.14%), Mongolian (5.3%, a difference of 0.15%), and Immigrants from France (5.3%, a difference of 0.18%).
| Demographics | Rating | Rank | Unemployment Among Ages 65 to 74 years |
| Spanish | 72.6 /100 | #152 | Good 5.3% |
| Immigrants | Cabo Verde | 72.5 /100 | #153 | Good 5.3% |
| Poles | 72.4 /100 | #154 | Good 5.3% |
| Immigrants | Cameroon | 72.1 /100 | #155 | Good 5.3% |
| Dutch | 72.0 /100 | #156 | Good 5.3% |
| Immigrants | Eastern Europe | 71.5 /100 | #157 | Good 5.3% |
| Immigrants | France | 71.0 /100 | #158 | Good 5.3% |
| Immigrants | Czechoslovakia | 66.3 /100 | #159 | Good 5.3% |
| Bangladeshis | 65.8 /100 | #160 | Good 5.3% |
| Immigrants | Italy | 63.7 /100 | #161 | Good 5.3% |
| Immigrants | Eastern Asia | 62.5 /100 | #162 | Good 5.3% |
| Mongolians | 62.3 /100 | #163 | Good 5.3% |
| Immigrants | Philippines | 61.2 /100 | #164 | Good 5.3% |
| Immigrants | Bosnia and Herzegovina | 60.2 /100 | #165 | Good 5.3% |
| Slovaks | 60.0 /100 | #166 | Good 5.3% |
Demographics Similar to Immigrants from Bahamas by Unemployment Among Ages 65 to 74 years
In terms of unemployment among ages 65 to 74 years, the demographic groups most similar to Immigrants from Bahamas are Aleut (5.9%, a difference of 0.090%), Zimbabwean (5.9%, a difference of 0.11%), Immigrants from Dominica (6.0%, a difference of 0.37%), Immigrants from Central America (5.9%, a difference of 0.38%), and Immigrants from Mexico (6.0%, a difference of 0.59%).
| Demographics | Rating | Rank | Unemployment Among Ages 65 to 74 years |
| Vietnamese | 0.0 /100 | #313 | Tragic 5.9% |
| Immigrants | Venezuela | 0.0 /100 | #314 | Tragic 5.9% |
| Immigrants | Guatemala | 0.0 /100 | #315 | Tragic 5.9% |
| Immigrants | El Salvador | 0.0 /100 | #316 | Tragic 5.9% |
| Immigrants | Central America | 0.0 /100 | #317 | Tragic 5.9% |
| Zimbabweans | 0.0 /100 | #318 | Tragic 5.9% |
| Aleuts | 0.0 /100 | #319 | Tragic 5.9% |
| Immigrants | Bahamas | 0.0 /100 | #320 | Tragic 5.9% |
| Immigrants | Dominica | 0.0 /100 | #321 | Tragic 6.0% |
| Immigrants | Mexico | 0.0 /100 | #322 | Tragic 6.0% |
| Delaware | 0.0 /100 | #323 | Tragic 6.0% |
| Tohono O'odham | 0.0 /100 | #324 | Tragic 6.0% |
| Immigrants | Portugal | 0.0 /100 | #325 | Tragic 6.0% |
| Natives/Alaskans | 0.0 /100 | #326 | Tragic 6.0% |
| Shoshone | 0.0 /100 | #327 | Tragic 6.2% |