Immigrants from Colombia vs Korean 6th Grade
COMPARE
Immigrants from Colombia
Korean
6th Grade
6th Grade Comparison
Immigrants from Colombia
Koreans
96.4%
6TH GRADE
0.3/ 100
METRIC RATING
263rd/ 347
METRIC RANK
96.6%
6TH GRADE
1.9/ 100
METRIC RATING
240th/ 347
METRIC RANK
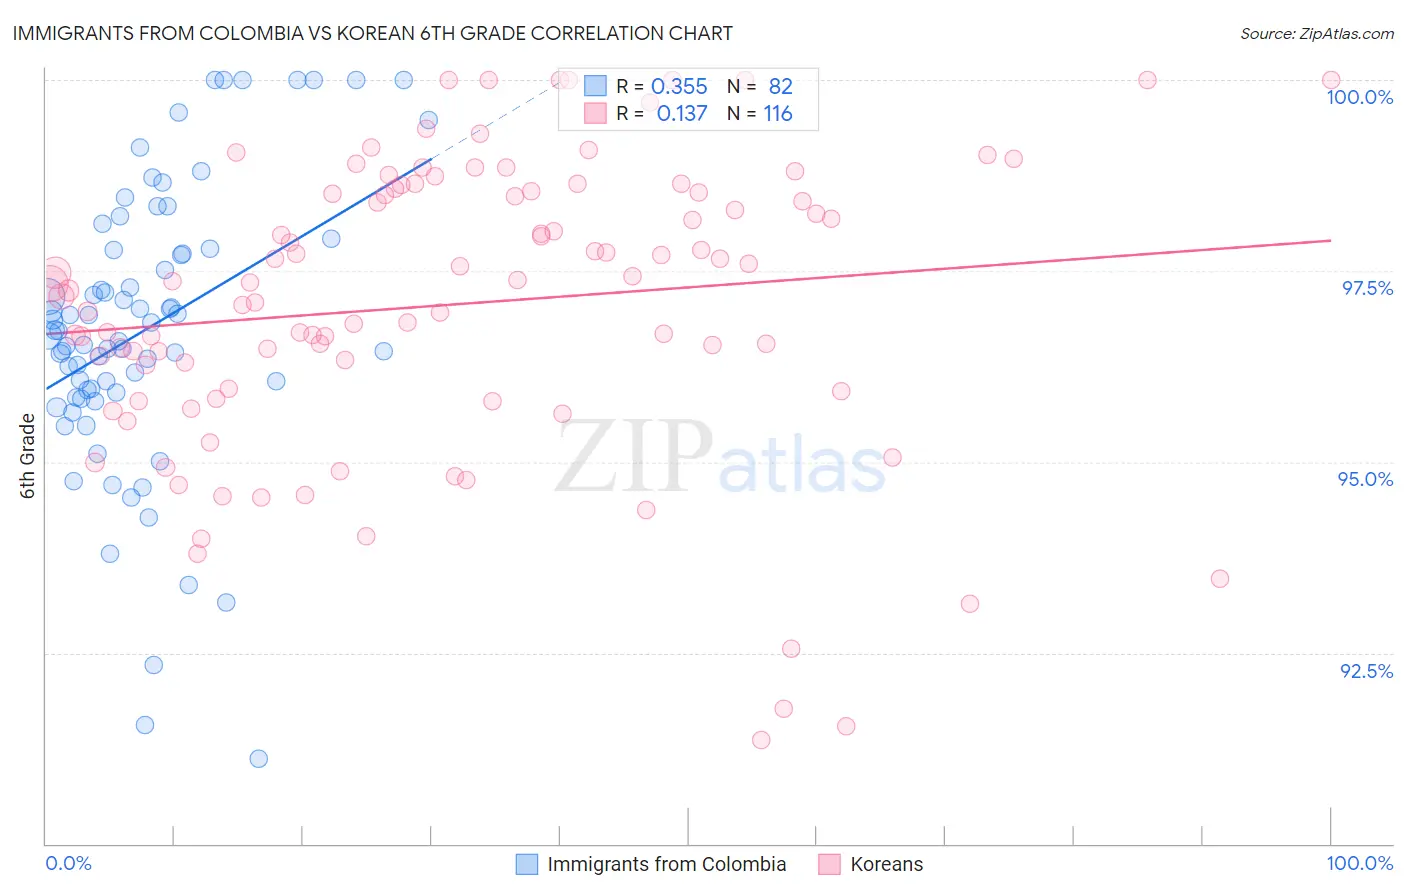
Immigrants from Colombia vs Korean 6th Grade Correlation Chart
The statistical analysis conducted on geographies consisting of 378,598,469 people shows a mild positive correlation between the proportion of Immigrants from Colombia and percentage of population with at least 6th grade education in the United States with a correlation coefficient (R) of 0.355 and weighted average of 96.4%. Similarly, the statistical analysis conducted on geographies consisting of 510,946,939 people shows a poor positive correlation between the proportion of Koreans and percentage of population with at least 6th grade education in the United States with a correlation coefficient (R) of 0.137 and weighted average of 96.6%, a difference of 0.23%.
6th Grade Correlation Summary
| Measurement | Immigrants from Colombia | Korean |
| Minimum | 91.1% | 91.4% |
| Maximum | 100.0% | 100.0% |
| Range | 8.9% | 8.6% |
| Mean | 96.7% | 97.1% |
| Median | 96.7% | 97.3% |
| Interquartile 25% (IQ1) | 95.9% | 95.9% |
| Interquartile 75% (IQ3) | 97.8% | 98.5% |
| Interquartile Range (IQR) | 1.9% | 2.6% |
| Standard Deviation (Sample) | 1.9% | 1.9% |
| Standard Deviation (Population) | 1.8% | 1.9% |
Similar Demographics by 6th Grade
Demographics Similar to Immigrants from Colombia by 6th Grade
In terms of 6th grade, the demographic groups most similar to Immigrants from Colombia are Armenian (96.4%, a difference of 0.0%), Immigrants from Nigeria (96.4%, a difference of 0.010%), Immigrants from Jamaica (96.4%, a difference of 0.010%), Ghanaian (96.4%, a difference of 0.020%), and Afghan (96.4%, a difference of 0.020%).
| Demographics | Rating | Rank | 6th Grade |
| U.S. Virgin Islanders | 0.5 /100 | #256 | Tragic 96.5% |
| Taiwanese | 0.5 /100 | #257 | Tragic 96.5% |
| Immigrants | China | 0.4 /100 | #258 | Tragic 96.4% |
| South Americans | 0.4 /100 | #259 | Tragic 96.4% |
| Peruvians | 0.4 /100 | #260 | Tragic 96.4% |
| Immigrants | Sierra Leone | 0.4 /100 | #261 | Tragic 96.4% |
| Immigrants | Nigeria | 0.3 /100 | #262 | Tragic 96.4% |
| Immigrants | Colombia | 0.3 /100 | #263 | Tragic 96.4% |
| Armenians | 0.3 /100 | #264 | Tragic 96.4% |
| Immigrants | Jamaica | 0.2 /100 | #265 | Tragic 96.4% |
| Ghanaians | 0.2 /100 | #266 | Tragic 96.4% |
| Afghans | 0.2 /100 | #267 | Tragic 96.4% |
| Immigrants | Uzbekistan | 0.2 /100 | #268 | Tragic 96.3% |
| West Indians | 0.2 /100 | #269 | Tragic 96.3% |
| Immigrants | South America | 0.2 /100 | #270 | Tragic 96.3% |
Demographics Similar to Koreans by 6th Grade
In terms of 6th grade, the demographic groups most similar to Koreans are Nigerian (96.6%, a difference of 0.0%), Indian (Asian) (96.6%, a difference of 0.0%), Senegalese (96.6%, a difference of 0.0%), Immigrants from Eastern Africa (96.6%, a difference of 0.010%), and Immigrants from Asia (96.6%, a difference of 0.010%).
| Demographics | Rating | Rank | 6th Grade |
| Yuman | 3.2 /100 | #233 | Tragic 96.7% |
| Uruguayans | 2.5 /100 | #234 | Tragic 96.6% |
| Asians | 2.4 /100 | #235 | Tragic 96.6% |
| Immigrants | Indonesia | 2.3 /100 | #236 | Tragic 96.6% |
| Immigrants | Eastern Africa | 2.0 /100 | #237 | Tragic 96.6% |
| Nigerians | 1.9 /100 | #238 | Tragic 96.6% |
| Indians (Asian) | 1.9 /100 | #239 | Tragic 96.6% |
| Koreans | 1.9 /100 | #240 | Tragic 96.6% |
| Senegalese | 1.8 /100 | #241 | Tragic 96.6% |
| Immigrants | Asia | 1.8 /100 | #242 | Tragic 96.6% |
| Immigrants | Liberia | 1.6 /100 | #243 | Tragic 96.6% |
| Ethiopians | 1.5 /100 | #244 | Tragic 96.6% |
| Immigrants | Costa Rica | 1.3 /100 | #245 | Tragic 96.6% |
| Immigrants | Africa | 1.3 /100 | #246 | Tragic 96.6% |
| Bolivians | 1.0 /100 | #247 | Tragic 96.5% |