Immigrants from Colombia vs Korean In Labor Force | Age 20-64
COMPARE
Immigrants from Colombia
Korean
In Labor Force | Age 20-64
In Labor Force | Age 20-64 Comparison
Immigrants from Colombia
Koreans
80.2%
IN LABOR FORCE | AGE 20-64
97.8/ 100
METRIC RATING
77th/ 347
METRIC RANK
79.8%
IN LABOR FORCE | AGE 20-64
79.6/ 100
METRIC RATING
144th/ 347
METRIC RANK
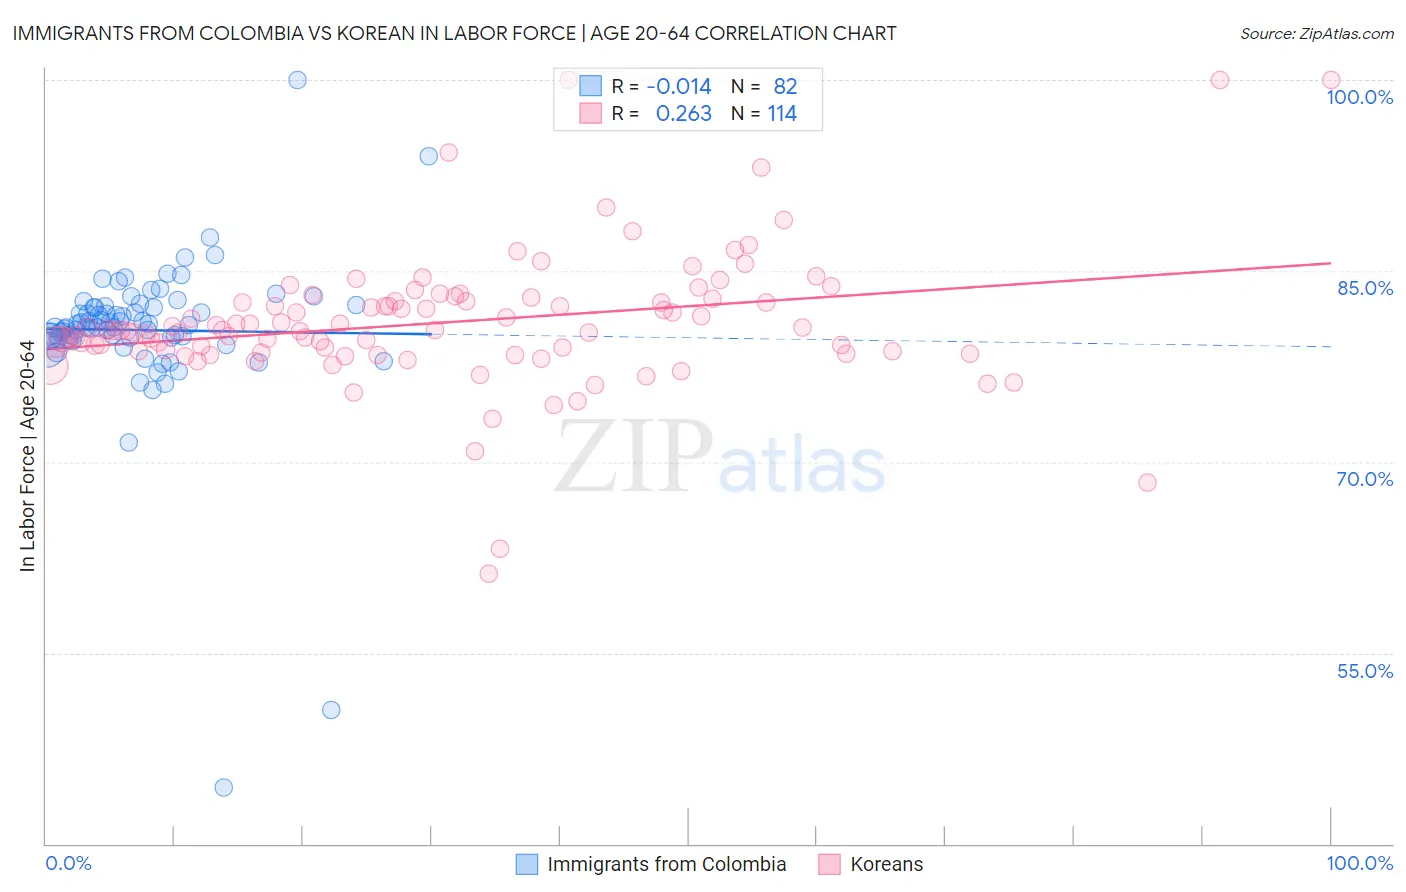
Immigrants from Colombia vs Korean In Labor Force | Age 20-64 Correlation Chart
The statistical analysis conducted on geographies consisting of 378,682,126 people shows no correlation between the proportion of Immigrants from Colombia and labor force participation rate among population between the ages 20 and 64 in the United States with a correlation coefficient (R) of -0.014 and weighted average of 80.2%. Similarly, the statistical analysis conducted on geographies consisting of 510,967,467 people shows a weak positive correlation between the proportion of Koreans and labor force participation rate among population between the ages 20 and 64 in the United States with a correlation coefficient (R) of 0.263 and weighted average of 79.8%, a difference of 0.49%.
In Labor Force | Age 20-64 Correlation Summary
| Measurement | Immigrants from Colombia | Korean |
| Minimum | 44.4% | 61.2% |
| Maximum | 100.0% | 100.0% |
| Range | 55.6% | 38.8% |
| Mean | 80.4% | 81.0% |
| Median | 80.6% | 80.3% |
| Interquartile 25% (IQ1) | 79.7% | 78.7% |
| Interquartile 75% (IQ3) | 82.1% | 82.7% |
| Interquartile Range (IQR) | 2.4% | 4.0% |
| Standard Deviation (Sample) | 6.3% | 5.4% |
| Standard Deviation (Population) | 6.3% | 5.4% |
Similar Demographics by In Labor Force | Age 20-64
Demographics Similar to Immigrants from Colombia by In Labor Force | Age 20-64
In terms of in labor force | age 20-64, the demographic groups most similar to Immigrants from Colombia are Egyptian (80.2%, a difference of 0.0%), Immigrants from Romania (80.2%, a difference of 0.0%), Immigrants from Afghanistan (80.2%, a difference of 0.010%), Asian (80.2%, a difference of 0.010%), and Immigrants from Croatia (80.1%, a difference of 0.020%).
| Demographics | Rating | Rank | In Labor Force | Age 20-64 |
| Immigrants | Turkey | 98.5 /100 | #70 | Exceptional 80.2% |
| Soviet Union | 98.5 /100 | #71 | Exceptional 80.2% |
| Eastern Europeans | 98.4 /100 | #72 | Exceptional 80.2% |
| Cypriots | 98.2 /100 | #73 | Exceptional 80.2% |
| Immigrants | Eastern Europe | 98.1 /100 | #74 | Exceptional 80.2% |
| Immigrants | Afghanistan | 97.9 /100 | #75 | Exceptional 80.2% |
| Egyptians | 97.8 /100 | #76 | Exceptional 80.2% |
| Immigrants | Colombia | 97.8 /100 | #77 | Exceptional 80.2% |
| Immigrants | Romania | 97.8 /100 | #78 | Exceptional 80.2% |
| Asians | 97.7 /100 | #79 | Exceptional 80.2% |
| Immigrants | Croatia | 97.6 /100 | #80 | Exceptional 80.1% |
| German Russians | 97.3 /100 | #81 | Exceptional 80.1% |
| Immigrants | Japan | 97.3 /100 | #82 | Exceptional 80.1% |
| Colombians | 97.3 /100 | #83 | Exceptional 80.1% |
| Immigrants | Latvia | 97.2 /100 | #84 | Exceptional 80.1% |
Demographics Similar to Koreans by In Labor Force | Age 20-64
In terms of in labor force | age 20-64, the demographic groups most similar to Koreans are Immigrants from Israel (79.8%, a difference of 0.0%), Slovak (79.8%, a difference of 0.0%), Immigrants from Sweden (79.8%, a difference of 0.0%), Pakistani (79.8%, a difference of 0.0%), and Immigrants from South Eastern Asia (79.8%, a difference of 0.010%).
| Demographics | Rating | Rank | In Labor Force | Age 20-64 |
| Immigrants | Ukraine | 86.5 /100 | #137 | Excellent 79.9% |
| Immigrants | Nigeria | 86.4 /100 | #138 | Excellent 79.9% |
| Immigrants | Spain | 83.9 /100 | #139 | Excellent 79.8% |
| Immigrants | South Eastern Asia | 80.4 /100 | #140 | Excellent 79.8% |
| Immigrants | Israel | 80.0 /100 | #141 | Good 79.8% |
| Slovaks | 79.9 /100 | #142 | Good 79.8% |
| Immigrants | Sweden | 79.7 /100 | #143 | Good 79.8% |
| Koreans | 79.6 /100 | #144 | Good 79.8% |
| Pakistanis | 79.3 /100 | #145 | Good 79.8% |
| Immigrants | Southern Europe | 78.9 /100 | #146 | Good 79.8% |
| Immigrants | Philippines | 78.0 /100 | #147 | Good 79.8% |
| Romanians | 77.6 /100 | #148 | Good 79.8% |
| Icelanders | 75.1 /100 | #149 | Good 79.7% |
| Costa Ricans | 72.4 /100 | #150 | Good 79.7% |
| Scandinavians | 72.0 /100 | #151 | Good 79.7% |