Immigrants from China vs Crow Female Unemployment
COMPARE
Immigrants from China
Crow
Female Unemployment
Female Unemployment Comparison
Immigrants from China
Crow
5.2%
FEMALE UNEMPLOYMENT
75.9/ 100
METRIC RATING
151st/ 347
METRIC RANK
12.1%
FEMALE UNEMPLOYMENT
0.0/ 100
METRIC RATING
347th/ 347
METRIC RANK
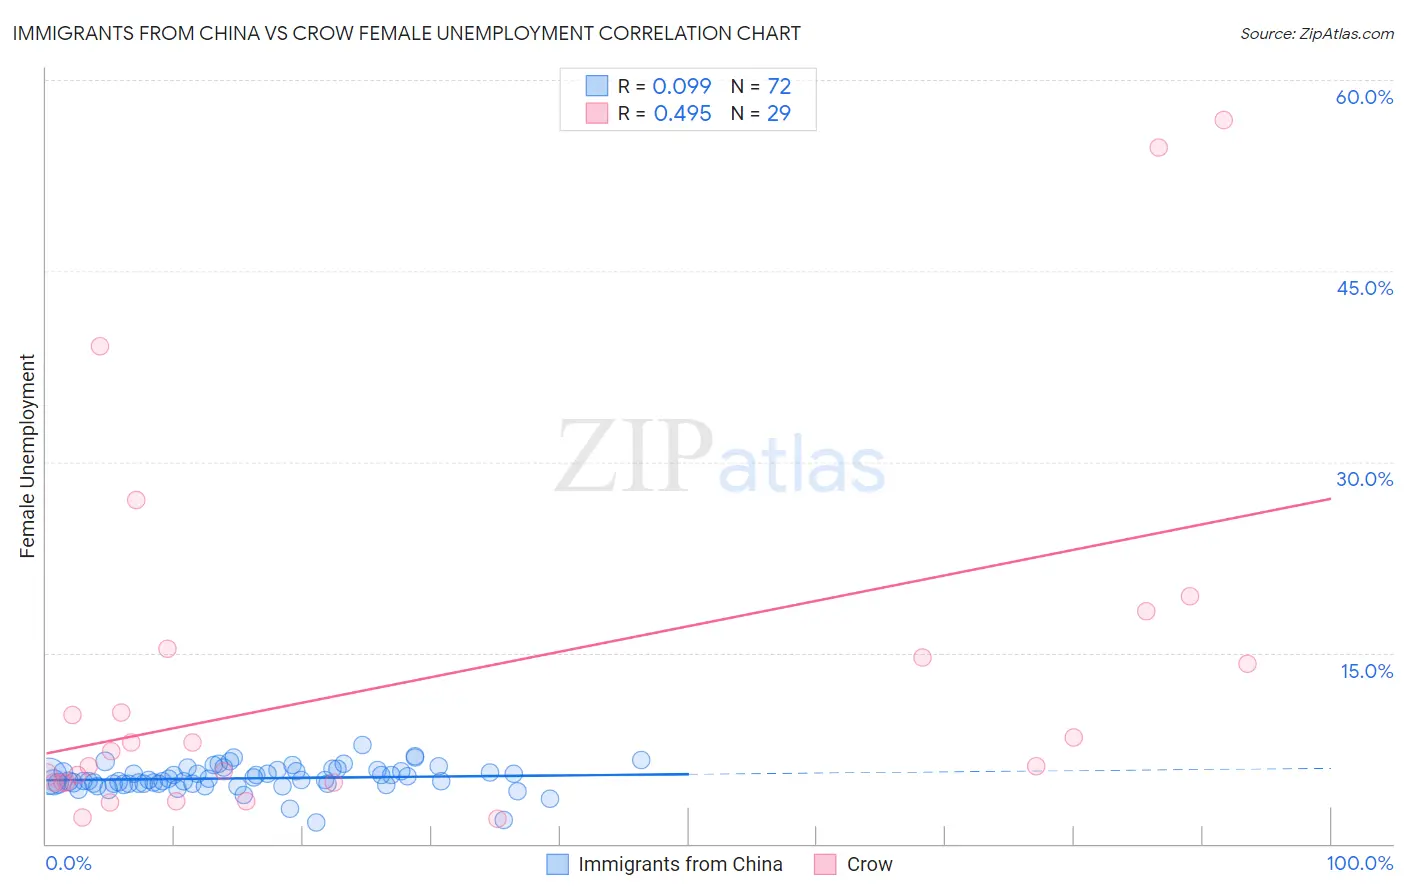
Immigrants from China vs Crow Female Unemployment Correlation Chart
The statistical analysis conducted on geographies consisting of 454,254,097 people shows a slight positive correlation between the proportion of Immigrants from China and unemploymnet rate among females in the United States with a correlation coefficient (R) of 0.099 and weighted average of 5.2%. Similarly, the statistical analysis conducted on geographies consisting of 59,046,149 people shows a moderate positive correlation between the proportion of Crow and unemploymnet rate among females in the United States with a correlation coefficient (R) of 0.495 and weighted average of 12.1%, a difference of 134.5%.
Female Unemployment Correlation Summary
| Measurement | Immigrants from China | Crow |
| Minimum | 1.7% | 2.0% |
| Maximum | 7.7% | 56.9% |
| Range | 6.0% | 54.9% |
| Mean | 5.1% | 12.9% |
| Median | 5.1% | 7.3% |
| Interquartile 25% (IQ1) | 4.7% | 4.8% |
| Interquartile 75% (IQ3) | 5.8% | 14.9% |
| Interquartile Range (IQR) | 1.0% | 10.1% |
| Standard Deviation (Sample) | 1.0% | 14.4% |
| Standard Deviation (Population) | 1.0% | 14.1% |
Similar Demographics by Female Unemployment
Demographics Similar to Immigrants from China by Female Unemployment
In terms of female unemployment, the demographic groups most similar to Immigrants from China are Immigrants from Italy (5.2%, a difference of 0.080%), Immigrants from Greece (5.2%, a difference of 0.080%), Asian (5.2%, a difference of 0.21%), Egyptian (5.2%, a difference of 0.21%), and Immigrants from Argentina (5.2%, a difference of 0.24%).
| Demographics | Rating | Rank | Female Unemployment |
| Immigrants | Jordan | 80.4 /100 | #144 | Excellent 5.1% |
| Immigrants | Oceania | 79.5 /100 | #145 | Good 5.2% |
| Immigrants | Norway | 79.4 /100 | #146 | Good 5.2% |
| Argentineans | 79.2 /100 | #147 | Good 5.2% |
| Immigrants | Argentina | 78.7 /100 | #148 | Good 5.2% |
| Asians | 78.3 /100 | #149 | Good 5.2% |
| Egyptians | 78.3 /100 | #150 | Good 5.2% |
| Immigrants | China | 75.9 /100 | #151 | Good 5.2% |
| Immigrants | Italy | 75.0 /100 | #152 | Good 5.2% |
| Immigrants | Greece | 74.9 /100 | #153 | Good 5.2% |
| South Africans | 70.8 /100 | #154 | Good 5.2% |
| Immigrants | Egypt | 70.0 /100 | #155 | Good 5.2% |
| Immigrants | Northern Africa | 69.6 /100 | #156 | Good 5.2% |
| Immigrants | Russia | 69.3 /100 | #157 | Good 5.2% |
| Albanians | 68.3 /100 | #158 | Good 5.2% |
Demographics Similar to Crow by Female Unemployment
In terms of female unemployment, the demographic groups most similar to Crow are Yup'ik (10.9%, a difference of 11.5%), Yuman (9.6%, a difference of 26.4%), Pima (9.3%, a difference of 29.9%), Arapaho (8.8%, a difference of 37.9%), and Puerto Rican (8.3%, a difference of 45.3%).
| Demographics | Rating | Rank | Female Unemployment |
| Menominee | 0.0 /100 | #333 | Tragic 7.0% |
| Immigrants | Armenia | 0.0 /100 | #334 | Tragic 7.1% |
| Dominicans | 0.0 /100 | #335 | Tragic 7.2% |
| Immigrants | Dominican Republic | 0.0 /100 | #336 | Tragic 7.2% |
| Navajo | 0.0 /100 | #337 | Tragic 7.3% |
| Tohono O'odham | 0.0 /100 | #338 | Tragic 7.7% |
| Immigrants | Yemen | 0.0 /100 | #339 | Tragic 7.8% |
| Hopi | 0.0 /100 | #340 | Tragic 8.1% |
| Inupiat | 0.0 /100 | #341 | Tragic 8.2% |
| Puerto Ricans | 0.0 /100 | #342 | Tragic 8.3% |
| Arapaho | 0.0 /100 | #343 | Tragic 8.8% |
| Pima | 0.0 /100 | #344 | Tragic 9.3% |
| Yuman | 0.0 /100 | #345 | Tragic 9.6% |
| Yup'ik | 0.0 /100 | #346 | Tragic 10.9% |
| Crow | 0.0 /100 | #347 | Tragic 12.1% |