Immigrants from China vs Cuban Female Unemployment
COMPARE
Immigrants from China
Cuban
Female Unemployment
Female Unemployment Comparison
Immigrants from China
Cubans
5.2%
FEMALE UNEMPLOYMENT
75.9/ 100
METRIC RATING
151st/ 347
METRIC RANK
4.9%
FEMALE UNEMPLOYMENT
98.3/ 100
METRIC RATING
67th/ 347
METRIC RANK
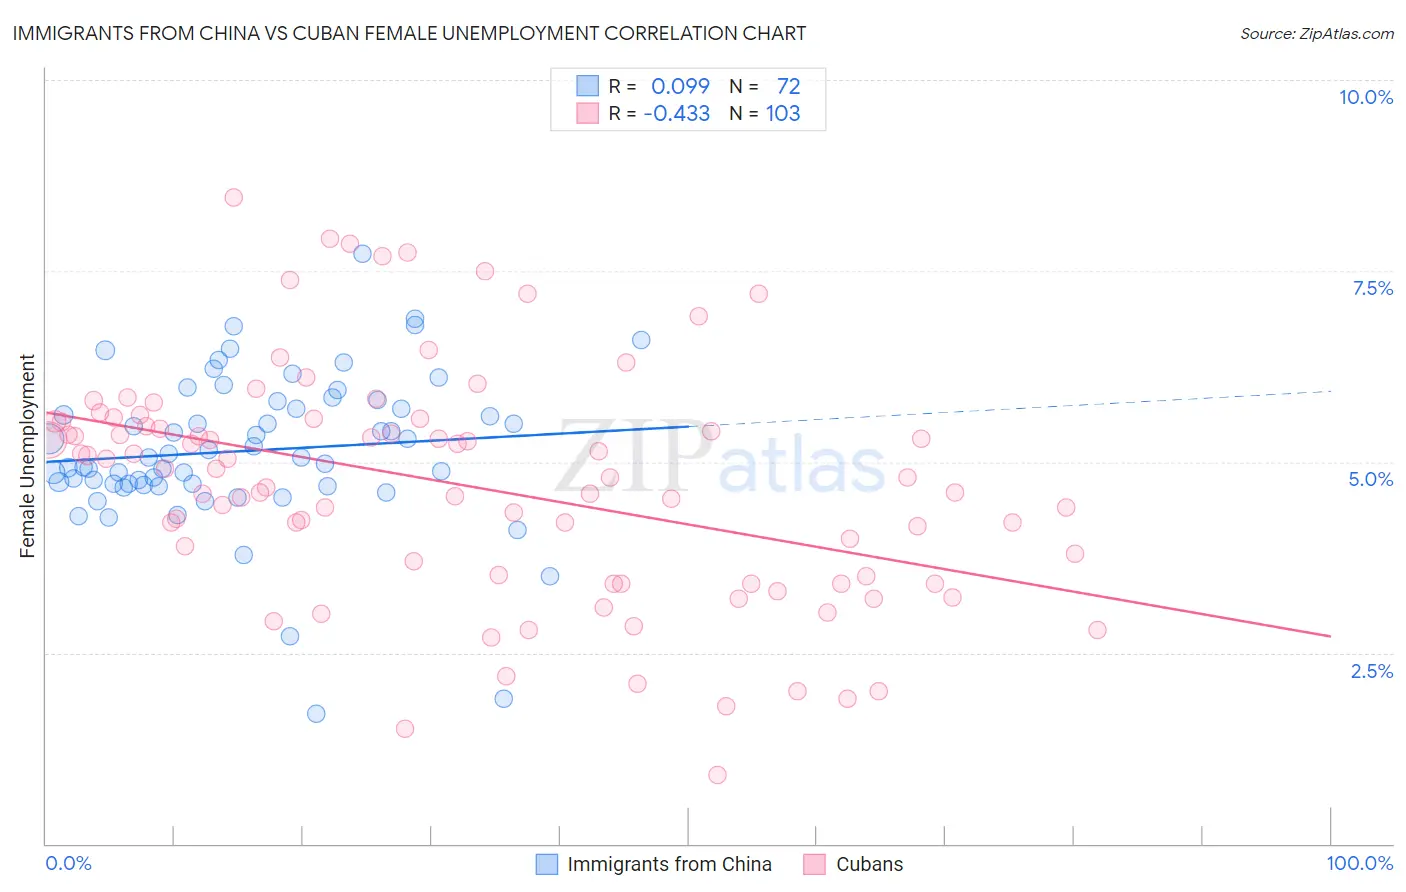
Immigrants from China vs Cuban Female Unemployment Correlation Chart
The statistical analysis conducted on geographies consisting of 454,254,097 people shows a slight positive correlation between the proportion of Immigrants from China and unemploymnet rate among females in the United States with a correlation coefficient (R) of 0.099 and weighted average of 5.2%. Similarly, the statistical analysis conducted on geographies consisting of 446,472,096 people shows a moderate negative correlation between the proportion of Cubans and unemploymnet rate among females in the United States with a correlation coefficient (R) of -0.433 and weighted average of 4.9%, a difference of 4.6%.
Female Unemployment Correlation Summary
| Measurement | Immigrants from China | Cuban |
| Minimum | 1.7% | 0.90% |
| Maximum | 7.7% | 8.5% |
| Range | 6.0% | 7.6% |
| Mean | 5.1% | 4.7% |
| Median | 5.1% | 4.8% |
| Interquartile 25% (IQ1) | 4.7% | 3.5% |
| Interquartile 75% (IQ3) | 5.8% | 5.5% |
| Interquartile Range (IQR) | 1.0% | 2.0% |
| Standard Deviation (Sample) | 1.0% | 1.5% |
| Standard Deviation (Population) | 1.0% | 1.5% |
Similar Demographics by Female Unemployment
Demographics Similar to Immigrants from China by Female Unemployment
In terms of female unemployment, the demographic groups most similar to Immigrants from China are Immigrants from Italy (5.2%, a difference of 0.080%), Immigrants from Greece (5.2%, a difference of 0.080%), Asian (5.2%, a difference of 0.21%), Egyptian (5.2%, a difference of 0.21%), and Immigrants from Argentina (5.2%, a difference of 0.24%).
| Demographics | Rating | Rank | Female Unemployment |
| Immigrants | Jordan | 80.4 /100 | #144 | Excellent 5.1% |
| Immigrants | Oceania | 79.5 /100 | #145 | Good 5.2% |
| Immigrants | Norway | 79.4 /100 | #146 | Good 5.2% |
| Argentineans | 79.2 /100 | #147 | Good 5.2% |
| Immigrants | Argentina | 78.7 /100 | #148 | Good 5.2% |
| Asians | 78.3 /100 | #149 | Good 5.2% |
| Egyptians | 78.3 /100 | #150 | Good 5.2% |
| Immigrants | China | 75.9 /100 | #151 | Good 5.2% |
| Immigrants | Italy | 75.0 /100 | #152 | Good 5.2% |
| Immigrants | Greece | 74.9 /100 | #153 | Good 5.2% |
| South Africans | 70.8 /100 | #154 | Good 5.2% |
| Immigrants | Egypt | 70.0 /100 | #155 | Good 5.2% |
| Immigrants | Northern Africa | 69.6 /100 | #156 | Good 5.2% |
| Immigrants | Russia | 69.3 /100 | #157 | Good 5.2% |
| Albanians | 68.3 /100 | #158 | Good 5.2% |
Demographics Similar to Cubans by Female Unemployment
In terms of female unemployment, the demographic groups most similar to Cubans are Hungarian (4.9%, a difference of 0.0%), Tlingit-Haida (4.9%, a difference of 0.010%), Immigrants from Ireland (4.9%, a difference of 0.020%), Immigrants from North America (4.9%, a difference of 0.030%), and Osage (4.9%, a difference of 0.060%).
| Demographics | Rating | Rank | Female Unemployment |
| Immigrants | Scotland | 98.6 /100 | #60 | Exceptional 4.9% |
| Immigrants | Canada | 98.6 /100 | #61 | Exceptional 4.9% |
| Immigrants | Nepal | 98.6 /100 | #62 | Exceptional 4.9% |
| Immigrants | Belgium | 98.5 /100 | #63 | Exceptional 4.9% |
| Celtics | 98.5 /100 | #64 | Exceptional 4.9% |
| Immigrants | North America | 98.3 /100 | #65 | Exceptional 4.9% |
| Hungarians | 98.3 /100 | #66 | Exceptional 4.9% |
| Cubans | 98.3 /100 | #67 | Exceptional 4.9% |
| Tlingit-Haida | 98.3 /100 | #68 | Exceptional 4.9% |
| Immigrants | Ireland | 98.2 /100 | #69 | Exceptional 4.9% |
| Osage | 98.2 /100 | #70 | Exceptional 4.9% |
| German Russians | 98.1 /100 | #71 | Exceptional 4.9% |
| Immigrants | Northern Europe | 98.0 /100 | #72 | Exceptional 4.9% |
| Russians | 98.0 /100 | #73 | Exceptional 5.0% |
| Immigrants | Bolivia | 98.0 /100 | #74 | Exceptional 5.0% |