Immigrants from Nigeria vs Crow Female Unemployment
COMPARE
Immigrants from Nigeria
Crow
Female Unemployment
Female Unemployment Comparison
Immigrants from Nigeria
Crow
5.8%
FEMALE UNEMPLOYMENT
0.1/ 100
METRIC RATING
262nd/ 347
METRIC RANK
12.1%
FEMALE UNEMPLOYMENT
0.0/ 100
METRIC RATING
347th/ 347
METRIC RANK
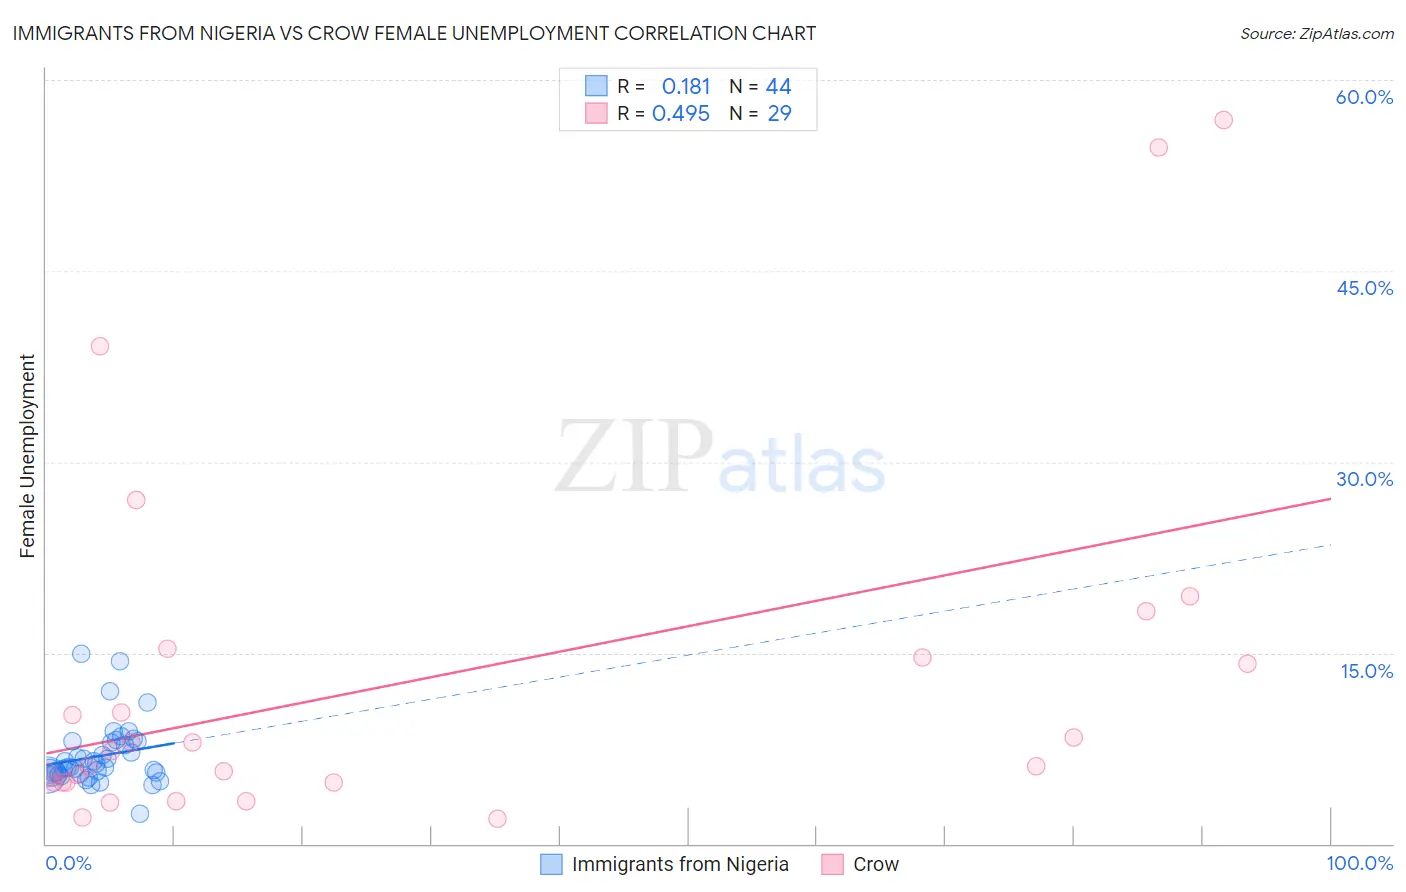
Immigrants from Nigeria vs Crow Female Unemployment Correlation Chart
The statistical analysis conducted on geographies consisting of 283,043,160 people shows a poor positive correlation between the proportion of Immigrants from Nigeria and unemploymnet rate among females in the United States with a correlation coefficient (R) of 0.181 and weighted average of 5.8%. Similarly, the statistical analysis conducted on geographies consisting of 59,046,149 people shows a moderate positive correlation between the proportion of Crow and unemploymnet rate among females in the United States with a correlation coefficient (R) of 0.495 and weighted average of 12.1%, a difference of 109.8%.
Female Unemployment Correlation Summary
| Measurement | Immigrants from Nigeria | Crow |
| Minimum | 2.4% | 2.0% |
| Maximum | 14.9% | 56.9% |
| Range | 12.5% | 54.9% |
| Mean | 6.9% | 12.9% |
| Median | 6.0% | 7.3% |
| Interquartile 25% (IQ1) | 5.4% | 4.8% |
| Interquartile 75% (IQ3) | 8.0% | 14.9% |
| Interquartile Range (IQR) | 2.6% | 10.1% |
| Standard Deviation (Sample) | 2.4% | 14.4% |
| Standard Deviation (Population) | 2.4% | 14.1% |
Similar Demographics by Female Unemployment
Demographics Similar to Immigrants from Nigeria by Female Unemployment
In terms of female unemployment, the demographic groups most similar to Immigrants from Nigeria are Kiowa (5.8%, a difference of 0.030%), Nigerian (5.8%, a difference of 0.30%), Immigrants from Fiji (5.8%, a difference of 0.33%), Immigrants from Portugal (5.8%, a difference of 0.44%), and Immigrants from the Azores (5.8%, a difference of 0.67%).
| Demographics | Rating | Rank | Female Unemployment |
| Immigrants | Cameroon | 0.6 /100 | #255 | Tragic 5.7% |
| Sub-Saharan Africans | 0.4 /100 | #256 | Tragic 5.7% |
| Dutch West Indians | 0.3 /100 | #257 | Tragic 5.7% |
| Immigrants | Portugal | 0.2 /100 | #258 | Tragic 5.8% |
| Immigrants | Fiji | 0.2 /100 | #259 | Tragic 5.8% |
| Nigerians | 0.2 /100 | #260 | Tragic 5.8% |
| Kiowa | 0.1 /100 | #261 | Tragic 5.8% |
| Immigrants | Nigeria | 0.1 /100 | #262 | Tragic 5.8% |
| Immigrants | Azores | 0.1 /100 | #263 | Tragic 5.8% |
| Immigrants | Bahamas | 0.1 /100 | #264 | Tragic 5.8% |
| Blackfeet | 0.0 /100 | #265 | Tragic 5.9% |
| Cape Verdeans | 0.0 /100 | #266 | Tragic 5.9% |
| Nepalese | 0.0 /100 | #267 | Tragic 5.9% |
| Hondurans | 0.0 /100 | #268 | Tragic 5.9% |
| Immigrants | Western Africa | 0.0 /100 | #269 | Tragic 5.9% |
Demographics Similar to Crow by Female Unemployment
In terms of female unemployment, the demographic groups most similar to Crow are Yup'ik (10.9%, a difference of 11.5%), Yuman (9.6%, a difference of 26.4%), Pima (9.3%, a difference of 29.9%), Arapaho (8.8%, a difference of 37.9%), and Puerto Rican (8.3%, a difference of 45.3%).
| Demographics | Rating | Rank | Female Unemployment |
| Menominee | 0.0 /100 | #333 | Tragic 7.0% |
| Immigrants | Armenia | 0.0 /100 | #334 | Tragic 7.1% |
| Dominicans | 0.0 /100 | #335 | Tragic 7.2% |
| Immigrants | Dominican Republic | 0.0 /100 | #336 | Tragic 7.2% |
| Navajo | 0.0 /100 | #337 | Tragic 7.3% |
| Tohono O'odham | 0.0 /100 | #338 | Tragic 7.7% |
| Immigrants | Yemen | 0.0 /100 | #339 | Tragic 7.8% |
| Hopi | 0.0 /100 | #340 | Tragic 8.1% |
| Inupiat | 0.0 /100 | #341 | Tragic 8.2% |
| Puerto Ricans | 0.0 /100 | #342 | Tragic 8.3% |
| Arapaho | 0.0 /100 | #343 | Tragic 8.8% |
| Pima | 0.0 /100 | #344 | Tragic 9.3% |
| Yuman | 0.0 /100 | #345 | Tragic 9.6% |
| Yup'ik | 0.0 /100 | #346 | Tragic 10.9% |
| Crow | 0.0 /100 | #347 | Tragic 12.1% |