Immigrants from China vs Immigrants from Kenya Female Unemployment
COMPARE
Immigrants from China
Immigrants from Kenya
Female Unemployment
Female Unemployment Comparison
Immigrants from China
Immigrants from Kenya
5.2%
FEMALE UNEMPLOYMENT
75.9/ 100
METRIC RATING
151st/ 347
METRIC RANK
5.0%
FEMALE UNEMPLOYMENT
94.8/ 100
METRIC RATING
102nd/ 347
METRIC RANK
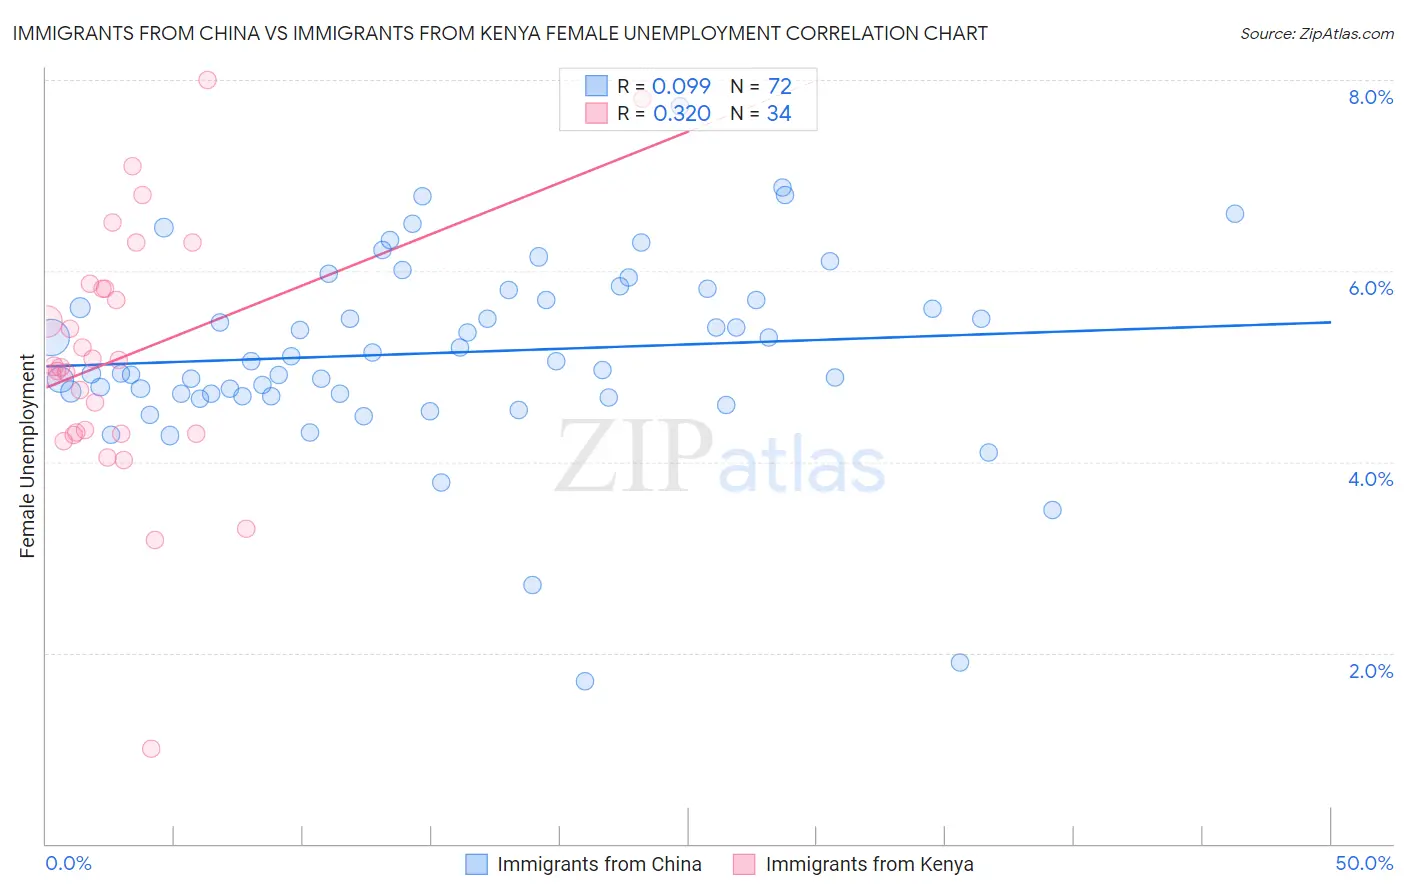
Immigrants from China vs Immigrants from Kenya Female Unemployment Correlation Chart
The statistical analysis conducted on geographies consisting of 454,254,097 people shows a slight positive correlation between the proportion of Immigrants from China and unemploymnet rate among females in the United States with a correlation coefficient (R) of 0.099 and weighted average of 5.2%. Similarly, the statistical analysis conducted on geographies consisting of 217,820,254 people shows a mild positive correlation between the proportion of Immigrants from Kenya and unemploymnet rate among females in the United States with a correlation coefficient (R) of 0.320 and weighted average of 5.0%, a difference of 2.8%.
Female Unemployment Correlation Summary
| Measurement | Immigrants from China | Immigrants from Kenya |
| Minimum | 1.7% | 1.0% |
| Maximum | 7.7% | 8.0% |
| Range | 6.0% | 7.0% |
| Mean | 5.1% | 5.1% |
| Median | 5.1% | 5.0% |
| Interquartile 25% (IQ1) | 4.7% | 4.3% |
| Interquartile 75% (IQ3) | 5.8% | 5.8% |
| Interquartile Range (IQR) | 1.0% | 1.5% |
| Standard Deviation (Sample) | 1.0% | 1.3% |
| Standard Deviation (Population) | 1.0% | 1.3% |
Similar Demographics by Female Unemployment
Demographics Similar to Immigrants from China by Female Unemployment
In terms of female unemployment, the demographic groups most similar to Immigrants from China are Immigrants from Italy (5.2%, a difference of 0.080%), Immigrants from Greece (5.2%, a difference of 0.080%), Asian (5.2%, a difference of 0.21%), Egyptian (5.2%, a difference of 0.21%), and Immigrants from Argentina (5.2%, a difference of 0.24%).
| Demographics | Rating | Rank | Female Unemployment |
| Immigrants | Jordan | 80.4 /100 | #144 | Excellent 5.1% |
| Immigrants | Oceania | 79.5 /100 | #145 | Good 5.2% |
| Immigrants | Norway | 79.4 /100 | #146 | Good 5.2% |
| Argentineans | 79.2 /100 | #147 | Good 5.2% |
| Immigrants | Argentina | 78.7 /100 | #148 | Good 5.2% |
| Asians | 78.3 /100 | #149 | Good 5.2% |
| Egyptians | 78.3 /100 | #150 | Good 5.2% |
| Immigrants | China | 75.9 /100 | #151 | Good 5.2% |
| Immigrants | Italy | 75.0 /100 | #152 | Good 5.2% |
| Immigrants | Greece | 74.9 /100 | #153 | Good 5.2% |
| South Africans | 70.8 /100 | #154 | Good 5.2% |
| Immigrants | Egypt | 70.0 /100 | #155 | Good 5.2% |
| Immigrants | Northern Africa | 69.6 /100 | #156 | Good 5.2% |
| Immigrants | Russia | 69.3 /100 | #157 | Good 5.2% |
| Albanians | 68.3 /100 | #158 | Good 5.2% |
Demographics Similar to Immigrants from Kenya by Female Unemployment
In terms of female unemployment, the demographic groups most similar to Immigrants from Kenya are Immigrants from Czechoslovakia (5.0%, a difference of 0.050%), Somali (5.0%, a difference of 0.080%), Indonesian (5.0%, a difference of 0.10%), Immigrants from Somalia (5.0%, a difference of 0.12%), and Immigrants from Kuwait (5.0%, a difference of 0.12%).
| Demographics | Rating | Rank | Female Unemployment |
| Burmese | 95.6 /100 | #95 | Exceptional 5.0% |
| Immigrants | South Central Asia | 95.5 /100 | #96 | Exceptional 5.0% |
| Immigrants | Somalia | 95.2 /100 | #97 | Exceptional 5.0% |
| Immigrants | Kuwait | 95.2 /100 | #98 | Exceptional 5.0% |
| Immigrants | Zaire | 95.2 /100 | #99 | Exceptional 5.0% |
| Indonesians | 95.1 /100 | #100 | Exceptional 5.0% |
| Immigrants | Czechoslovakia | 95.0 /100 | #101 | Exceptional 5.0% |
| Immigrants | Kenya | 94.8 /100 | #102 | Exceptional 5.0% |
| Somalis | 94.6 /100 | #103 | Exceptional 5.0% |
| Kenyans | 93.7 /100 | #104 | Exceptional 5.0% |
| Immigrants | England | 93.6 /100 | #105 | Exceptional 5.0% |
| Paraguayans | 93.2 /100 | #106 | Exceptional 5.1% |
| Immigrants | Switzerland | 93.1 /100 | #107 | Exceptional 5.1% |
| Puget Sound Salish | 93.0 /100 | #108 | Exceptional 5.1% |
| Immigrants | Eastern Africa | 92.8 /100 | #109 | Exceptional 5.1% |