Mexican vs Crow Female Unemployment
COMPARE
Mexican
Crow
Female Unemployment
Female Unemployment Comparison
Mexicans
Crow
6.1%
FEMALE UNEMPLOYMENT
0.0/ 100
METRIC RATING
293rd/ 347
METRIC RANK
12.1%
FEMALE UNEMPLOYMENT
0.0/ 100
METRIC RATING
347th/ 347
METRIC RANK
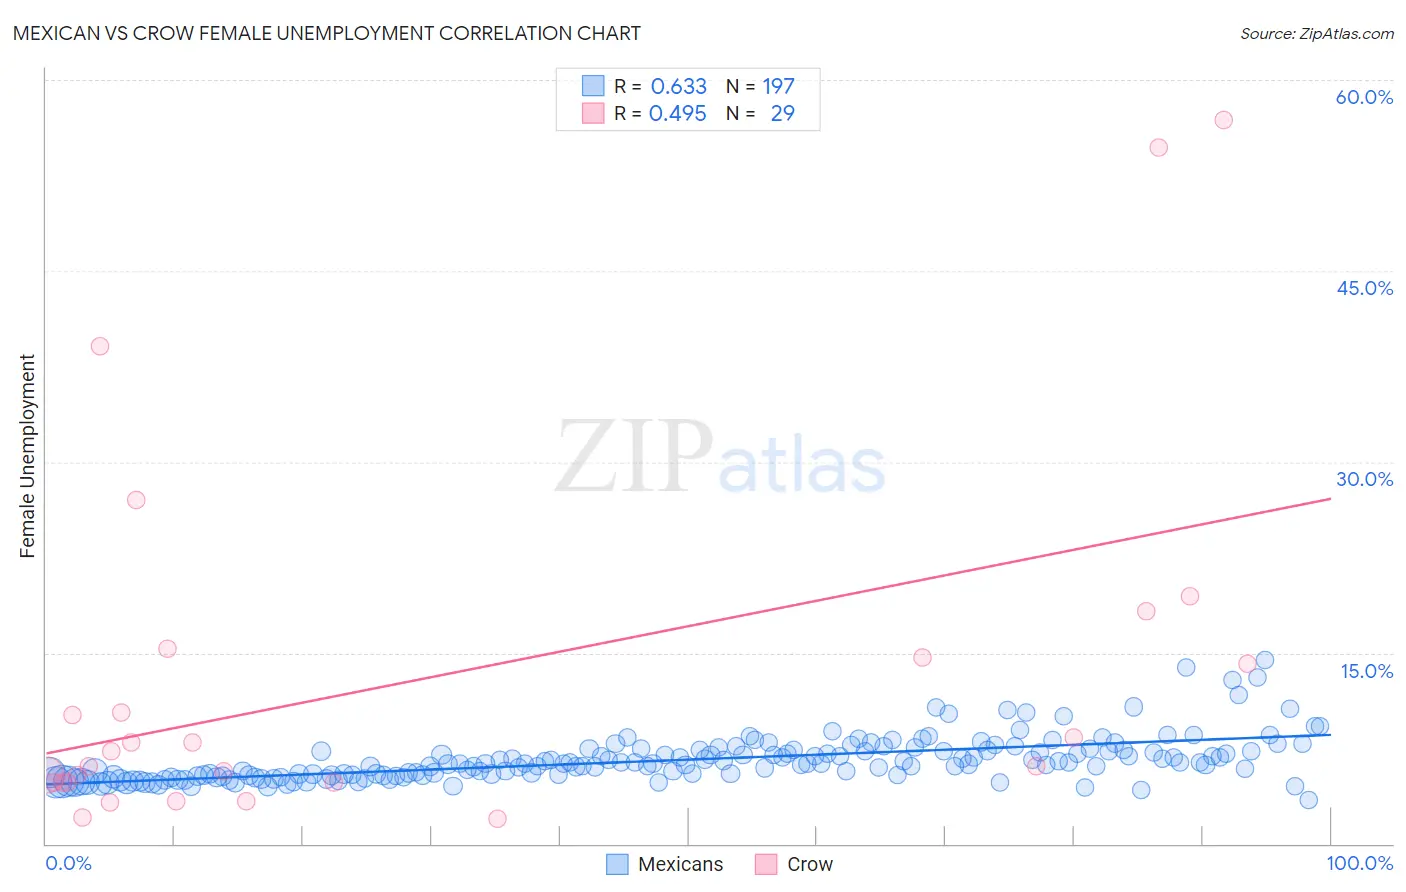
Mexican vs Crow Female Unemployment Correlation Chart
The statistical analysis conducted on geographies consisting of 553,339,596 people shows a significant positive correlation between the proportion of Mexicans and unemploymnet rate among females in the United States with a correlation coefficient (R) of 0.633 and weighted average of 6.1%. Similarly, the statistical analysis conducted on geographies consisting of 59,046,149 people shows a moderate positive correlation between the proportion of Crow and unemploymnet rate among females in the United States with a correlation coefficient (R) of 0.495 and weighted average of 12.1%, a difference of 98.4%.
Female Unemployment Correlation Summary
| Measurement | Mexican | Crow |
| Minimum | 3.4% | 2.0% |
| Maximum | 14.5% | 56.9% |
| Range | 11.0% | 54.9% |
| Mean | 6.6% | 12.9% |
| Median | 6.3% | 7.3% |
| Interquartile 25% (IQ1) | 5.4% | 4.8% |
| Interquartile 75% (IQ3) | 7.3% | 14.9% |
| Interquartile Range (IQR) | 1.9% | 10.1% |
| Standard Deviation (Sample) | 1.8% | 14.4% |
| Standard Deviation (Population) | 1.8% | 14.1% |
Similar Demographics by Female Unemployment
Demographics Similar to Mexicans by Female Unemployment
In terms of female unemployment, the demographic groups most similar to Mexicans are Immigrants from Trinidad and Tobago (6.1%, a difference of 0.080%), Immigrants from El Salvador (6.1%, a difference of 0.10%), Immigrants from West Indies (6.1%, a difference of 0.15%), Immigrants from Latin America (6.1%, a difference of 0.20%), and Alaskan Athabascan (6.1%, a difference of 0.22%).
| Demographics | Rating | Rank | Female Unemployment |
| Chippewa | 0.0 /100 | #286 | Tragic 6.1% |
| Immigrants | Guatemala | 0.0 /100 | #287 | Tragic 6.1% |
| Haitians | 0.0 /100 | #288 | Tragic 6.1% |
| Trinidadians and Tobagonians | 0.0 /100 | #289 | Tragic 6.1% |
| Immigrants | Caribbean | 0.0 /100 | #290 | Tragic 6.1% |
| Immigrants | West Indies | 0.0 /100 | #291 | Tragic 6.1% |
| Immigrants | Trinidad and Tobago | 0.0 /100 | #292 | Tragic 6.1% |
| Mexicans | 0.0 /100 | #293 | Tragic 6.1% |
| Immigrants | El Salvador | 0.0 /100 | #294 | Tragic 6.1% |
| Immigrants | Latin America | 0.0 /100 | #295 | Tragic 6.1% |
| Alaskan Athabascans | 0.0 /100 | #296 | Tragic 6.1% |
| West Indians | 0.0 /100 | #297 | Tragic 6.1% |
| Jamaicans | 0.0 /100 | #298 | Tragic 6.1% |
| Ute | 0.0 /100 | #299 | Tragic 6.1% |
| Immigrants | Haiti | 0.0 /100 | #300 | Tragic 6.1% |
Demographics Similar to Crow by Female Unemployment
In terms of female unemployment, the demographic groups most similar to Crow are Yup'ik (10.9%, a difference of 11.5%), Yuman (9.6%, a difference of 26.4%), Pima (9.3%, a difference of 29.9%), Arapaho (8.8%, a difference of 37.9%), and Puerto Rican (8.3%, a difference of 45.3%).
| Demographics | Rating | Rank | Female Unemployment |
| Menominee | 0.0 /100 | #333 | Tragic 7.0% |
| Immigrants | Armenia | 0.0 /100 | #334 | Tragic 7.1% |
| Dominicans | 0.0 /100 | #335 | Tragic 7.2% |
| Immigrants | Dominican Republic | 0.0 /100 | #336 | Tragic 7.2% |
| Navajo | 0.0 /100 | #337 | Tragic 7.3% |
| Tohono O'odham | 0.0 /100 | #338 | Tragic 7.7% |
| Immigrants | Yemen | 0.0 /100 | #339 | Tragic 7.8% |
| Hopi | 0.0 /100 | #340 | Tragic 8.1% |
| Inupiat | 0.0 /100 | #341 | Tragic 8.2% |
| Puerto Ricans | 0.0 /100 | #342 | Tragic 8.3% |
| Arapaho | 0.0 /100 | #343 | Tragic 8.8% |
| Pima | 0.0 /100 | #344 | Tragic 9.3% |
| Yuman | 0.0 /100 | #345 | Tragic 9.6% |
| Yup'ik | 0.0 /100 | #346 | Tragic 10.9% |
| Crow | 0.0 /100 | #347 | Tragic 12.1% |