Immigrants from Hungary vs Hopi Female Unemployment
COMPARE
Immigrants from Hungary
Hopi
Female Unemployment
Female Unemployment Comparison
Immigrants from Hungary
Hopi
5.1%
FEMALE UNEMPLOYMENT
86.0/ 100
METRIC RATING
127th/ 347
METRIC RANK
8.1%
FEMALE UNEMPLOYMENT
0.0/ 100
METRIC RATING
340th/ 347
METRIC RANK
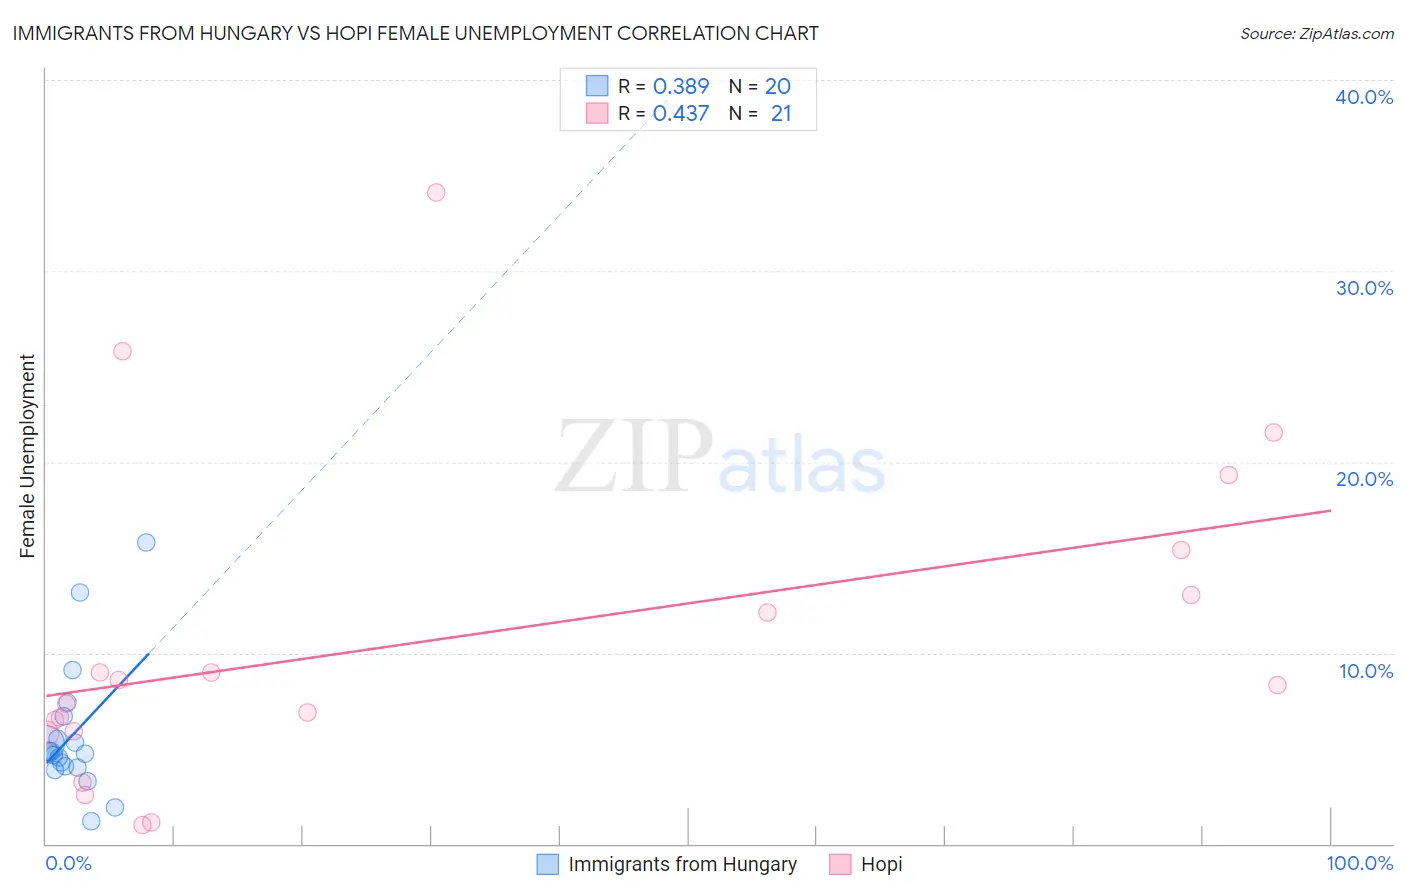
Immigrants from Hungary vs Hopi Female Unemployment Correlation Chart
The statistical analysis conducted on geographies consisting of 195,332,596 people shows a mild positive correlation between the proportion of Immigrants from Hungary and unemploymnet rate among females in the United States with a correlation coefficient (R) of 0.389 and weighted average of 5.1%. Similarly, the statistical analysis conducted on geographies consisting of 74,668,306 people shows a moderate positive correlation between the proportion of Hopi and unemploymnet rate among females in the United States with a correlation coefficient (R) of 0.437 and weighted average of 8.1%, a difference of 58.3%.
Female Unemployment Correlation Summary
| Measurement | Immigrants from Hungary | Hopi |
| Minimum | 1.2% | 1.0% |
| Maximum | 15.8% | 34.1% |
| Range | 14.6% | 33.1% |
| Mean | 5.7% | 10.6% |
| Median | 4.8% | 8.3% |
| Interquartile 25% (IQ1) | 4.0% | 5.8% |
| Interquartile 75% (IQ3) | 6.1% | 14.2% |
| Interquartile Range (IQR) | 2.1% | 8.4% |
| Standard Deviation (Sample) | 3.5% | 8.5% |
| Standard Deviation (Population) | 3.4% | 8.2% |
Similar Demographics by Female Unemployment
Demographics Similar to Immigrants from Hungary by Female Unemployment
In terms of female unemployment, the demographic groups most similar to Immigrants from Hungary are Chilean (5.1%, a difference of 0.030%), Immigrants from Korea (5.1%, a difference of 0.040%), Ethiopian (5.1%, a difference of 0.040%), Basque (5.1%, a difference of 0.060%), and Maltese (5.1%, a difference of 0.070%).
| Demographics | Rating | Rank | Female Unemployment |
| Immigrants | Romania | 88.1 /100 | #120 | Excellent 5.1% |
| Immigrants | Western Europe | 88.1 /100 | #121 | Excellent 5.1% |
| Immigrants | Germany | 87.6 /100 | #122 | Excellent 5.1% |
| Immigrants | South Africa | 87.6 /100 | #123 | Excellent 5.1% |
| Immigrants | Europe | 87.2 /100 | #124 | Excellent 5.1% |
| Basques | 86.5 /100 | #125 | Excellent 5.1% |
| Immigrants | Korea | 86.3 /100 | #126 | Excellent 5.1% |
| Immigrants | Hungary | 86.0 /100 | #127 | Excellent 5.1% |
| Chileans | 85.8 /100 | #128 | Excellent 5.1% |
| Ethiopians | 85.7 /100 | #129 | Excellent 5.1% |
| Maltese | 85.5 /100 | #130 | Excellent 5.1% |
| Immigrants | Ethiopia | 85.4 /100 | #131 | Excellent 5.1% |
| Immigrants | Sri Lanka | 85.0 /100 | #132 | Excellent 5.1% |
| Immigrants | Hong Kong | 84.8 /100 | #133 | Excellent 5.1% |
| Immigrants | Eritrea | 84.6 /100 | #134 | Excellent 5.1% |
Demographics Similar to Hopi by Female Unemployment
In terms of female unemployment, the demographic groups most similar to Hopi are Inupiat (8.2%, a difference of 0.76%), Puerto Rican (8.3%, a difference of 3.0%), Immigrants from Yemen (7.8%, a difference of 3.3%), Tohono O'odham (7.7%, a difference of 4.5%), and Arapaho (8.8%, a difference of 8.6%).
| Demographics | Rating | Rank | Female Unemployment |
| Menominee | 0.0 /100 | #333 | Tragic 7.0% |
| Immigrants | Armenia | 0.0 /100 | #334 | Tragic 7.1% |
| Dominicans | 0.0 /100 | #335 | Tragic 7.2% |
| Immigrants | Dominican Republic | 0.0 /100 | #336 | Tragic 7.2% |
| Navajo | 0.0 /100 | #337 | Tragic 7.3% |
| Tohono O'odham | 0.0 /100 | #338 | Tragic 7.7% |
| Immigrants | Yemen | 0.0 /100 | #339 | Tragic 7.8% |
| Hopi | 0.0 /100 | #340 | Tragic 8.1% |
| Inupiat | 0.0 /100 | #341 | Tragic 8.2% |
| Puerto Ricans | 0.0 /100 | #342 | Tragic 8.3% |
| Arapaho | 0.0 /100 | #343 | Tragic 8.8% |
| Pima | 0.0 /100 | #344 | Tragic 9.3% |
| Yuman | 0.0 /100 | #345 | Tragic 9.6% |
| Yup'ik | 0.0 /100 | #346 | Tragic 10.9% |
| Crow | 0.0 /100 | #347 | Tragic 12.1% |