Pueblo vs Hopi Female Unemployment
COMPARE
Pueblo
Hopi
Female Unemployment
Female Unemployment Comparison
Pueblo
Hopi
6.4%
FEMALE UNEMPLOYMENT
0.0/ 100
METRIC RATING
315th/ 347
METRIC RANK
8.1%
FEMALE UNEMPLOYMENT
0.0/ 100
METRIC RATING
340th/ 347
METRIC RANK
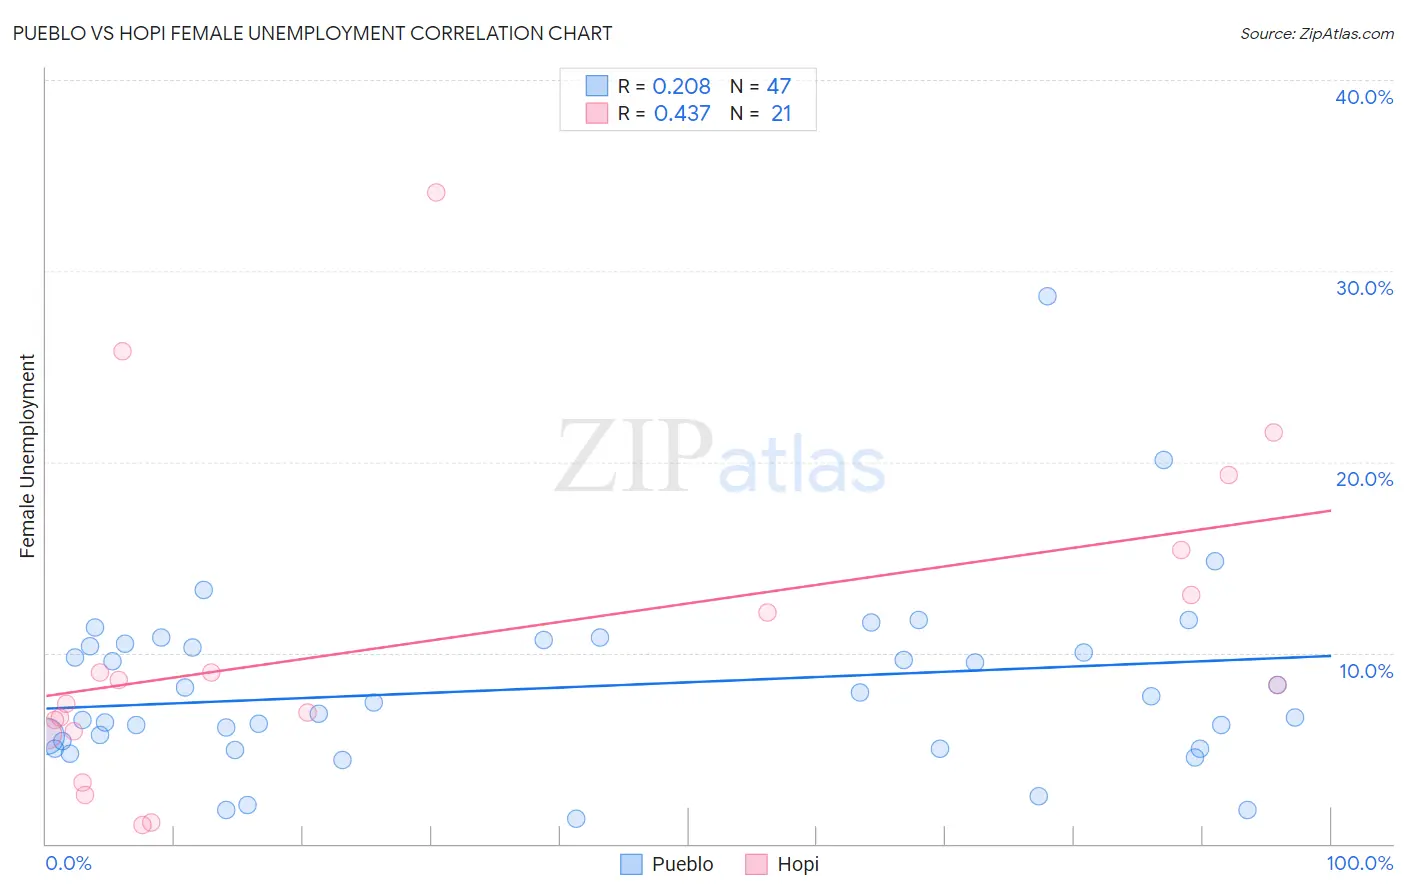
Pueblo vs Hopi Female Unemployment Correlation Chart
The statistical analysis conducted on geographies consisting of 119,838,706 people shows a weak positive correlation between the proportion of Pueblo and unemploymnet rate among females in the United States with a correlation coefficient (R) of 0.208 and weighted average of 6.4%. Similarly, the statistical analysis conducted on geographies consisting of 74,668,306 people shows a moderate positive correlation between the proportion of Hopi and unemploymnet rate among females in the United States with a correlation coefficient (R) of 0.437 and weighted average of 8.1%, a difference of 26.9%.
Female Unemployment Correlation Summary
| Measurement | Pueblo | Hopi |
| Minimum | 1.3% | 1.0% |
| Maximum | 28.7% | 34.1% |
| Range | 27.4% | 33.1% |
| Mean | 8.2% | 10.6% |
| Median | 7.4% | 8.3% |
| Interquartile 25% (IQ1) | 5.0% | 5.8% |
| Interquartile 75% (IQ3) | 10.5% | 14.2% |
| Interquartile Range (IQR) | 5.5% | 8.4% |
| Standard Deviation (Sample) | 4.8% | 8.5% |
| Standard Deviation (Population) | 4.7% | 8.2% |
Similar Demographics by Female Unemployment
Demographics Similar to Pueblo by Female Unemployment
In terms of female unemployment, the demographic groups most similar to Pueblo are Houma (6.4%, a difference of 0.29%), Immigrants from Ecuador (6.4%, a difference of 0.31%), Belizean (6.3%, a difference of 0.54%), Immigrants from Grenada (6.3%, a difference of 0.55%), and Immigrants from St. Vincent and the Grenadines (6.4%, a difference of 0.74%).
| Demographics | Rating | Rank | Female Unemployment |
| Hispanics or Latinos | 0.0 /100 | #308 | Tragic 6.2% |
| Ecuadorians | 0.0 /100 | #309 | Tragic 6.3% |
| Central American Indians | 0.0 /100 | #310 | Tragic 6.3% |
| Immigrants | Mexico | 0.0 /100 | #311 | Tragic 6.3% |
| Immigrants | Grenada | 0.0 /100 | #312 | Tragic 6.3% |
| Belizeans | 0.0 /100 | #313 | Tragic 6.3% |
| Immigrants | Ecuador | 0.0 /100 | #314 | Tragic 6.4% |
| Pueblo | 0.0 /100 | #315 | Tragic 6.4% |
| Houma | 0.0 /100 | #316 | Tragic 6.4% |
| Immigrants | St. Vincent and the Grenadines | 0.0 /100 | #317 | Tragic 6.4% |
| British West Indians | 0.0 /100 | #318 | Tragic 6.4% |
| Immigrants | Bangladesh | 0.0 /100 | #319 | Tragic 6.5% |
| Immigrants | Dominica | 0.0 /100 | #320 | Tragic 6.5% |
| Blacks/African Americans | 0.0 /100 | #321 | Tragic 6.5% |
| Vietnamese | 0.0 /100 | #322 | Tragic 6.5% |
Demographics Similar to Hopi by Female Unemployment
In terms of female unemployment, the demographic groups most similar to Hopi are Inupiat (8.2%, a difference of 0.76%), Puerto Rican (8.3%, a difference of 3.0%), Immigrants from Yemen (7.8%, a difference of 3.3%), Tohono O'odham (7.7%, a difference of 4.5%), and Arapaho (8.8%, a difference of 8.6%).
| Demographics | Rating | Rank | Female Unemployment |
| Menominee | 0.0 /100 | #333 | Tragic 7.0% |
| Immigrants | Armenia | 0.0 /100 | #334 | Tragic 7.1% |
| Dominicans | 0.0 /100 | #335 | Tragic 7.2% |
| Immigrants | Dominican Republic | 0.0 /100 | #336 | Tragic 7.2% |
| Navajo | 0.0 /100 | #337 | Tragic 7.3% |
| Tohono O'odham | 0.0 /100 | #338 | Tragic 7.7% |
| Immigrants | Yemen | 0.0 /100 | #339 | Tragic 7.8% |
| Hopi | 0.0 /100 | #340 | Tragic 8.1% |
| Inupiat | 0.0 /100 | #341 | Tragic 8.2% |
| Puerto Ricans | 0.0 /100 | #342 | Tragic 8.3% |
| Arapaho | 0.0 /100 | #343 | Tragic 8.8% |
| Pima | 0.0 /100 | #344 | Tragic 9.3% |
| Yuman | 0.0 /100 | #345 | Tragic 9.6% |
| Yup'ik | 0.0 /100 | #346 | Tragic 10.9% |
| Crow | 0.0 /100 | #347 | Tragic 12.1% |