Immigrants from Cabo Verde vs Sioux Unemployment Among Youth under 25 years
COMPARE
Immigrants from Cabo Verde
Sioux
Unemployment Among Youth under 25 years
Unemployment Among Youth under 25 years Comparison
Immigrants from Cabo Verde
Sioux
13.8%
UNEMPLOYMENT AMONG YOUTH UNDER 25 YEARS
0.0/ 100
METRIC RATING
300th/ 347
METRIC RANK
14.4%
UNEMPLOYMENT AMONG YOUTH UNDER 25 YEARS
0.0/ 100
METRIC RATING
315th/ 347
METRIC RANK
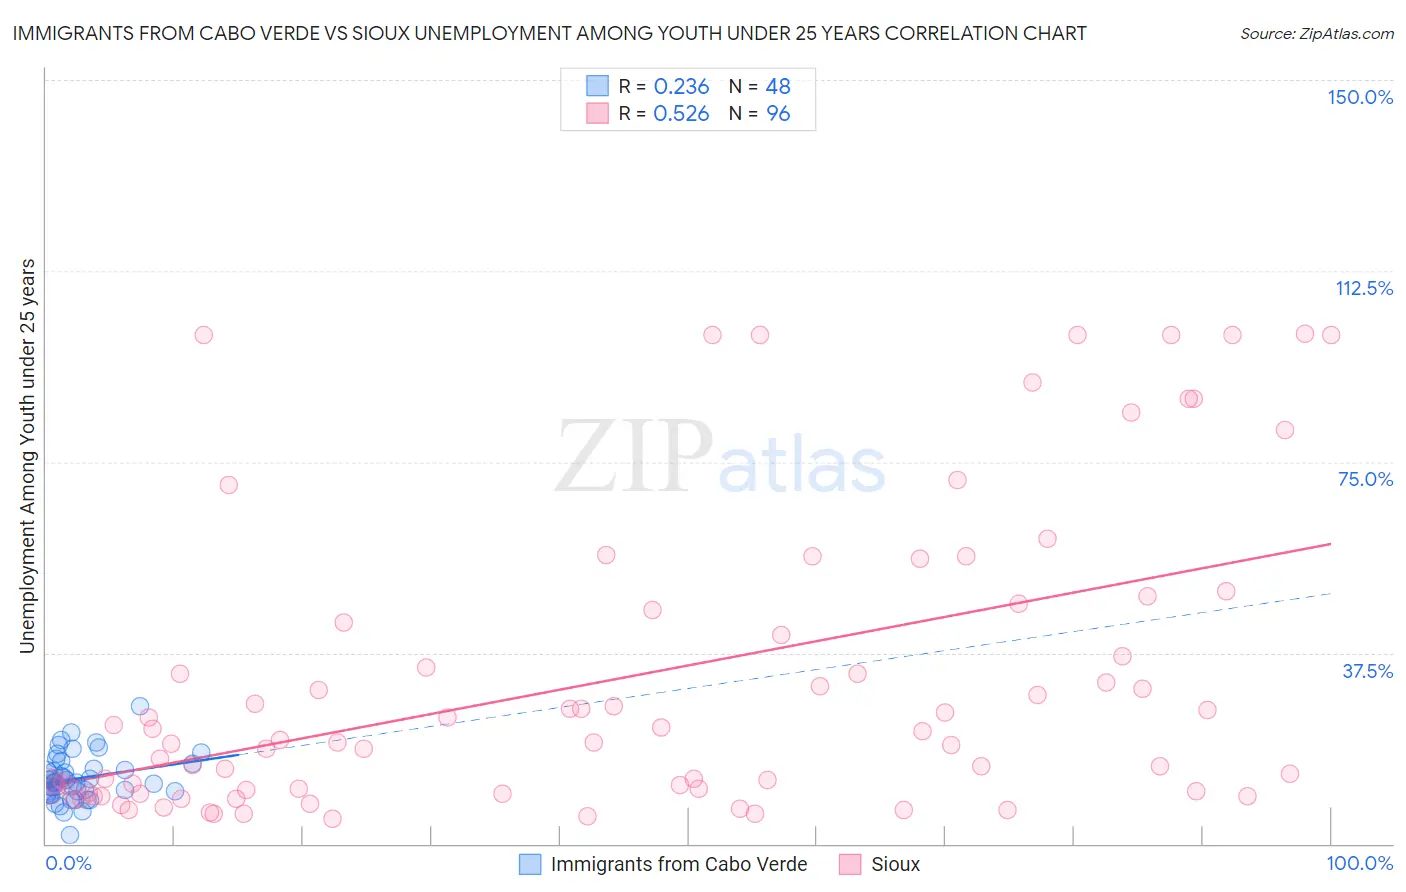
Immigrants from Cabo Verde vs Sioux Unemployment Among Youth under 25 years Correlation Chart
The statistical analysis conducted on geographies consisting of 38,057,869 people shows a weak positive correlation between the proportion of Immigrants from Cabo Verde and unemployment rate among youth under the age of 25 in the United States with a correlation coefficient (R) of 0.236 and weighted average of 13.8%. Similarly, the statistical analysis conducted on geographies consisting of 231,304,612 people shows a substantial positive correlation between the proportion of Sioux and unemployment rate among youth under the age of 25 in the United States with a correlation coefficient (R) of 0.526 and weighted average of 14.4%, a difference of 4.4%.
Unemployment Among Youth under 25 years Correlation Summary
| Measurement | Immigrants from Cabo Verde | Sioux |
| Minimum | 1.6% | 4.9% |
| Maximum | 26.9% | 100.1% |
| Range | 25.3% | 95.2% |
| Mean | 12.9% | 32.1% |
| Median | 12.0% | 20.2% |
| Interquartile 25% (IQ1) | 10.2% | 10.5% |
| Interquartile 75% (IQ3) | 15.2% | 44.7% |
| Interquartile Range (IQR) | 5.1% | 34.2% |
| Standard Deviation (Sample) | 4.6% | 29.3% |
| Standard Deviation (Population) | 4.6% | 29.2% |
Demographics Similar to Immigrants from Cabo Verde and Sioux by Unemployment Among Youth under 25 years
In terms of unemployment among youth under 25 years, the demographic groups most similar to Immigrants from Cabo Verde are Immigrants from Senegal (13.8%, a difference of 0.17%), Tohono O'odham (13.8%, a difference of 0.21%), Immigrants from Sierra Leone (13.8%, a difference of 0.22%), Belizean (13.8%, a difference of 0.25%), and Houma (13.8%, a difference of 0.26%). Similarly, the demographic groups most similar to Sioux are Jamaican (14.4%, a difference of 0.11%), Immigrants from Armenia (14.4%, a difference of 0.20%), Native/Alaskan (14.5%, a difference of 0.42%), Black/African American (14.5%, a difference of 0.51%), and Vietnamese (14.3%, a difference of 1.0%).
| Demographics | Rating | Rank | Unemployment Among Youth under 25 years |
| U.S. Virgin Islanders | 0.0 /100 | #297 | Tragic 13.6% |
| Shoshone | 0.0 /100 | #298 | Tragic 13.7% |
| Tohono O'odham | 0.0 /100 | #299 | Tragic 13.8% |
| Immigrants | Cabo Verde | 0.0 /100 | #300 | Tragic 13.8% |
| Immigrants | Senegal | 0.0 /100 | #301 | Tragic 13.8% |
| Immigrants | Sierra Leone | 0.0 /100 | #302 | Tragic 13.8% |
| Belizeans | 0.0 /100 | #303 | Tragic 13.8% |
| Houma | 0.0 /100 | #304 | Tragic 13.8% |
| Haitians | 0.0 /100 | #305 | Tragic 13.9% |
| Pueblo | 0.0 /100 | #306 | Tragic 13.9% |
| Immigrants | Haiti | 0.0 /100 | #307 | Tragic 14.0% |
| Immigrants | Belize | 0.0 /100 | #308 | Tragic 14.0% |
| Aleuts | 0.0 /100 | #309 | Tragic 14.1% |
| Immigrants | West Indies | 0.0 /100 | #310 | Tragic 14.2% |
| Immigrants | Bangladesh | 0.0 /100 | #311 | Tragic 14.2% |
| Vietnamese | 0.0 /100 | #312 | Tragic 14.3% |
| Immigrants | Armenia | 0.0 /100 | #313 | Tragic 14.4% |
| Jamaicans | 0.0 /100 | #314 | Tragic 14.4% |
| Sioux | 0.0 /100 | #315 | Tragic 14.4% |
| Natives/Alaskans | 0.0 /100 | #316 | Tragic 14.5% |
| Blacks/African Americans | 0.0 /100 | #317 | Tragic 14.5% |